Data Modeling Case Studies
Simulation, implementation guides, and decision models for situations where intuition is not enough.
This section covers the models that shape product and infrastructure decisions: Monte Carlo risk studies, system-capacity simulations, implementation specs, and queueing models that make tradeoffs visible before they become expensive.
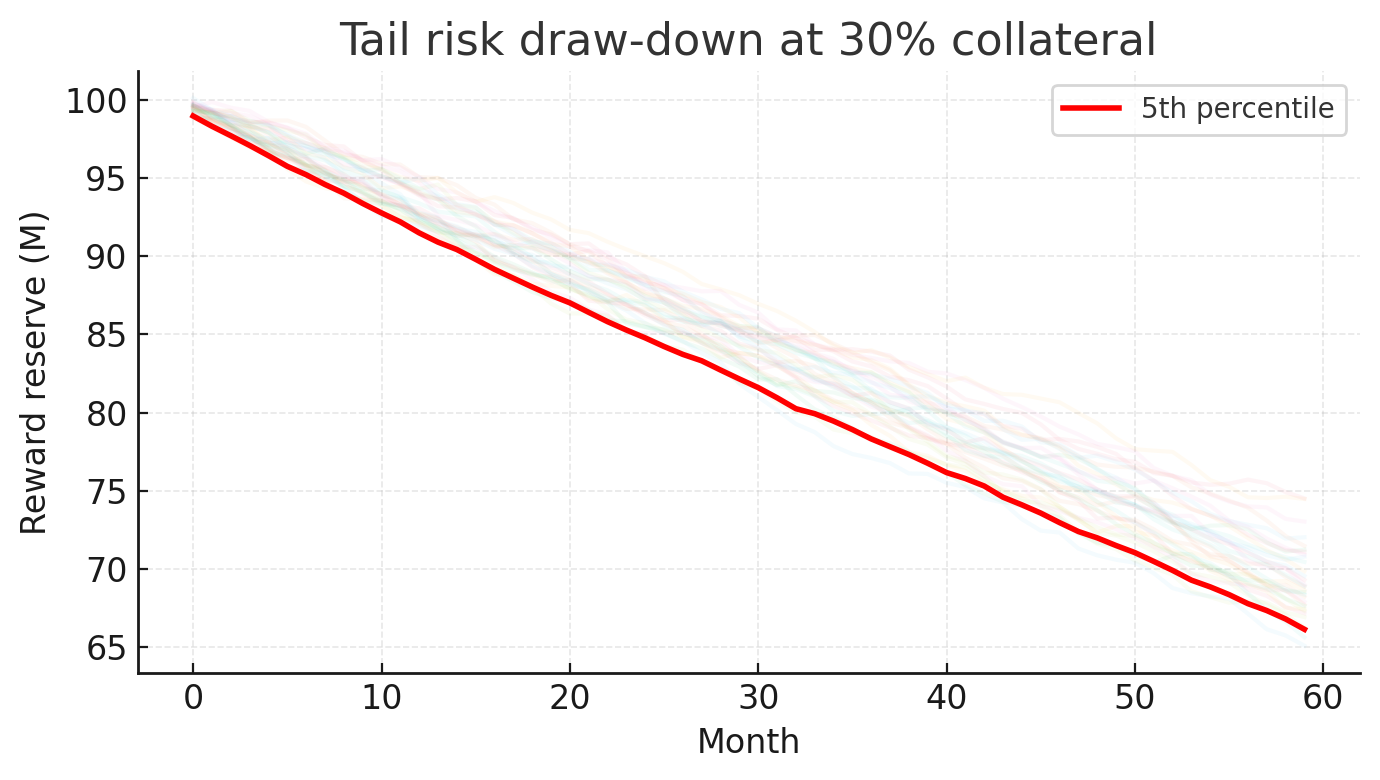
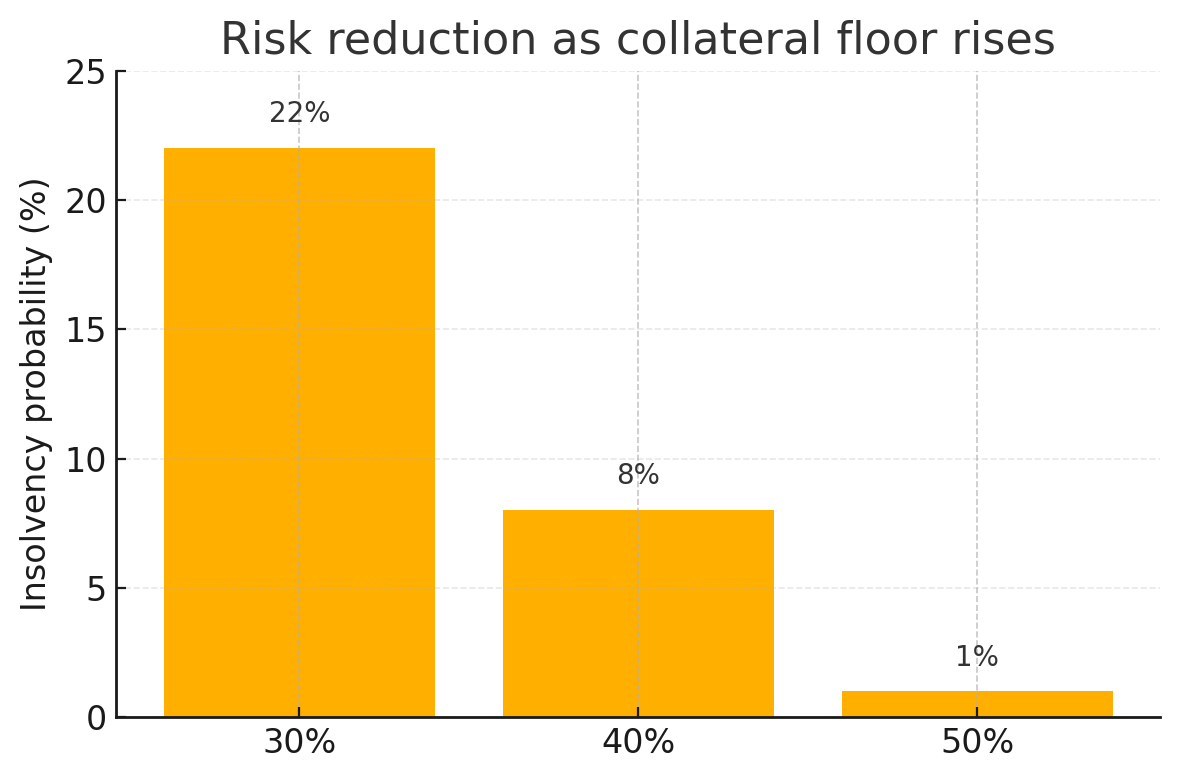
Collateral 50 percent - Why We Doubled the Safety Net
A Monte Carlo study that made tail risk visible enough to justify raising the collateral floor from 30 percent to 50 percent.
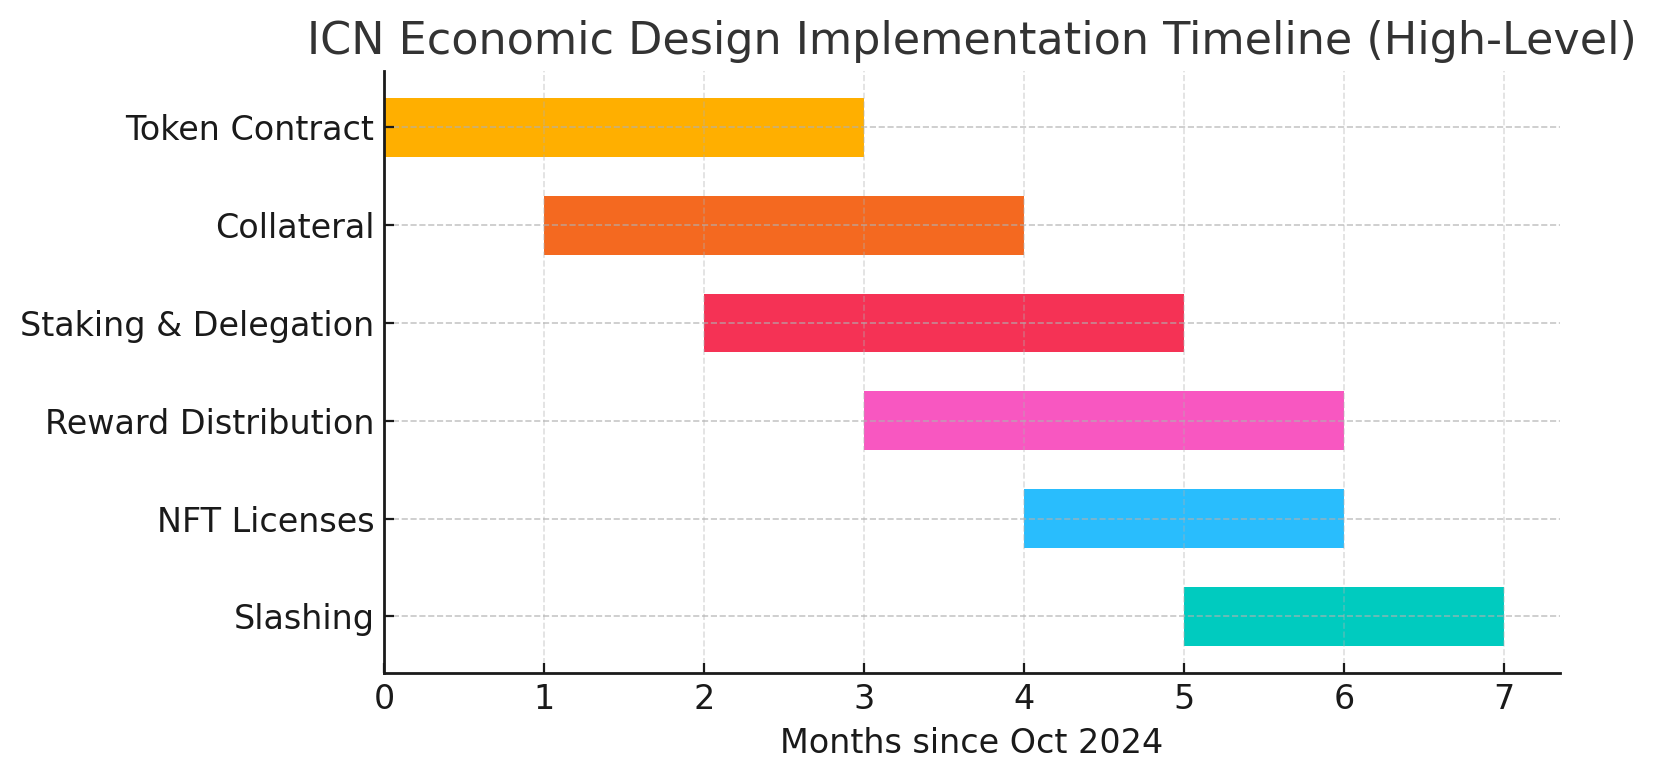
From White Paper to Build Spec - Writing the Tokenomics Implementation Guide
Turning an economic design document into module boundaries, ownership, and a build sequence engineers could actually ship against.
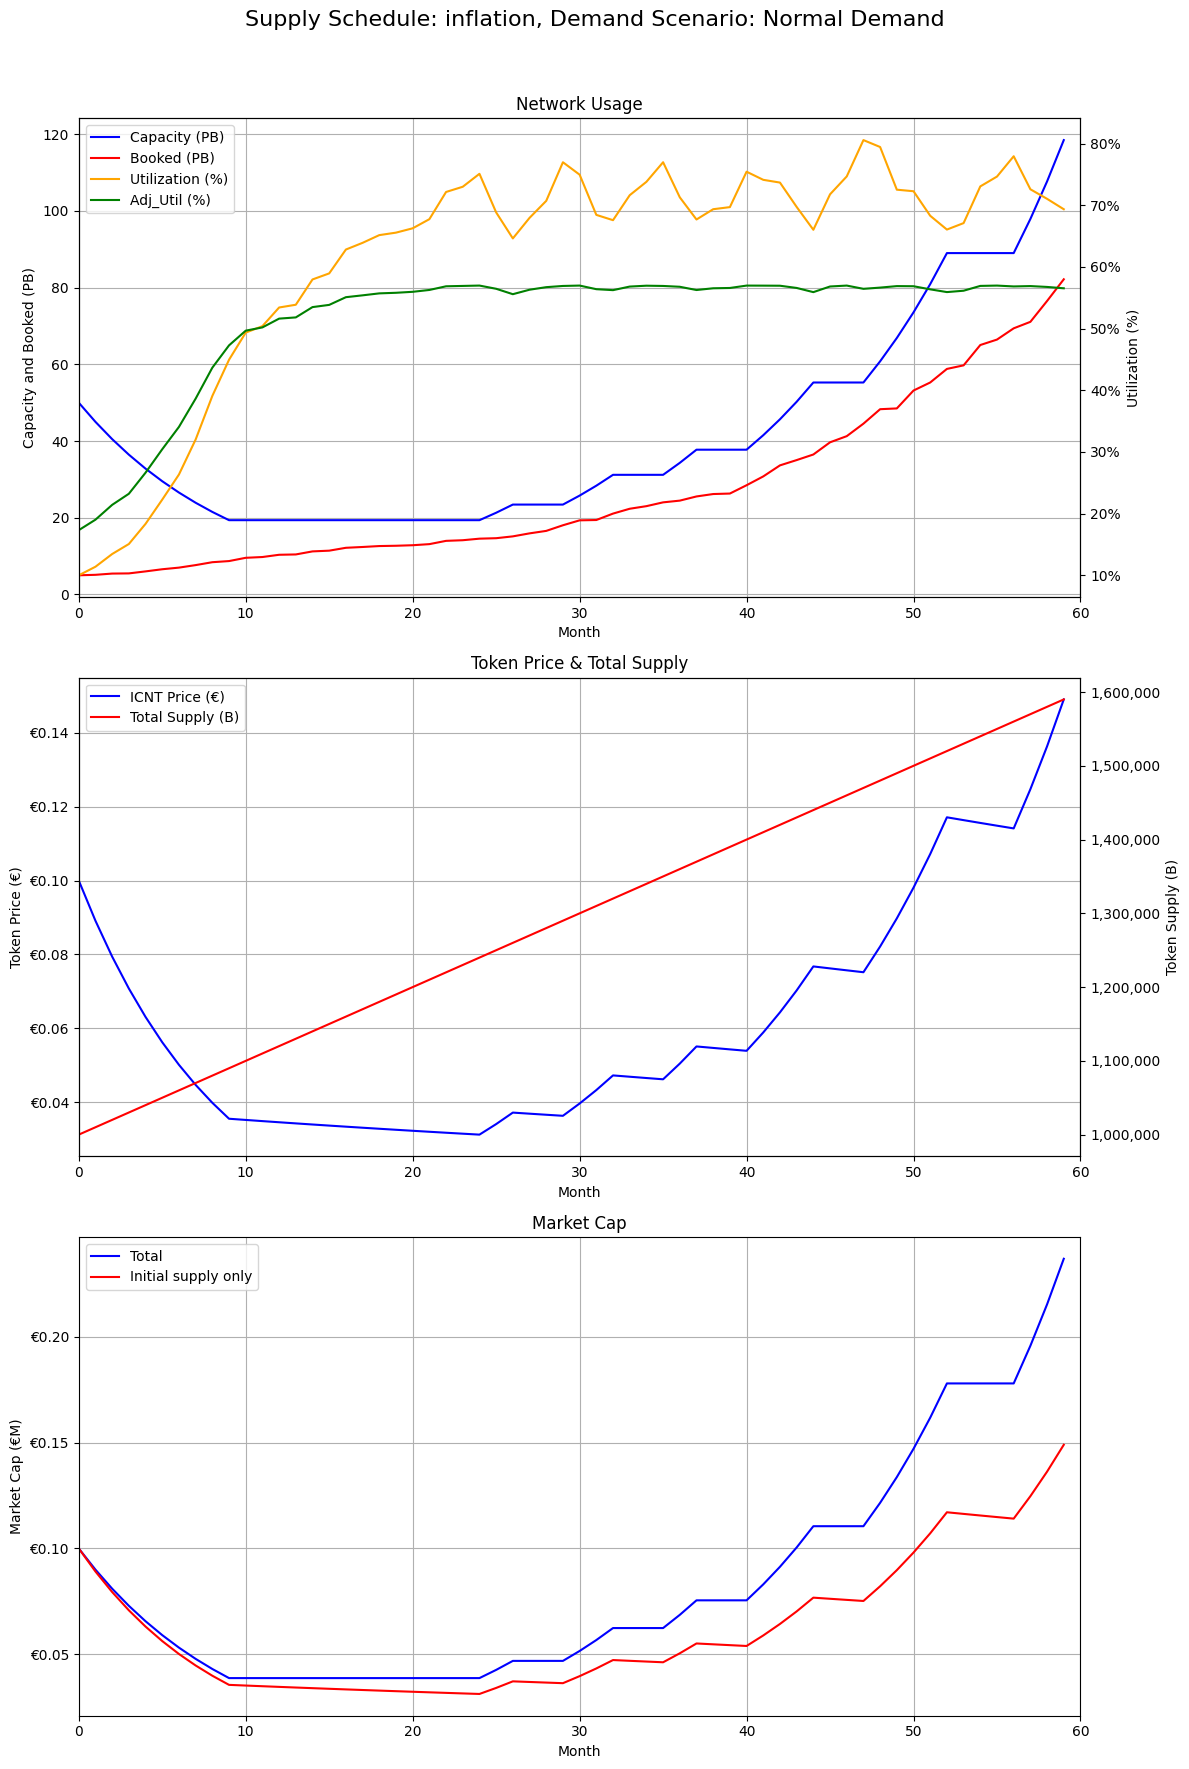
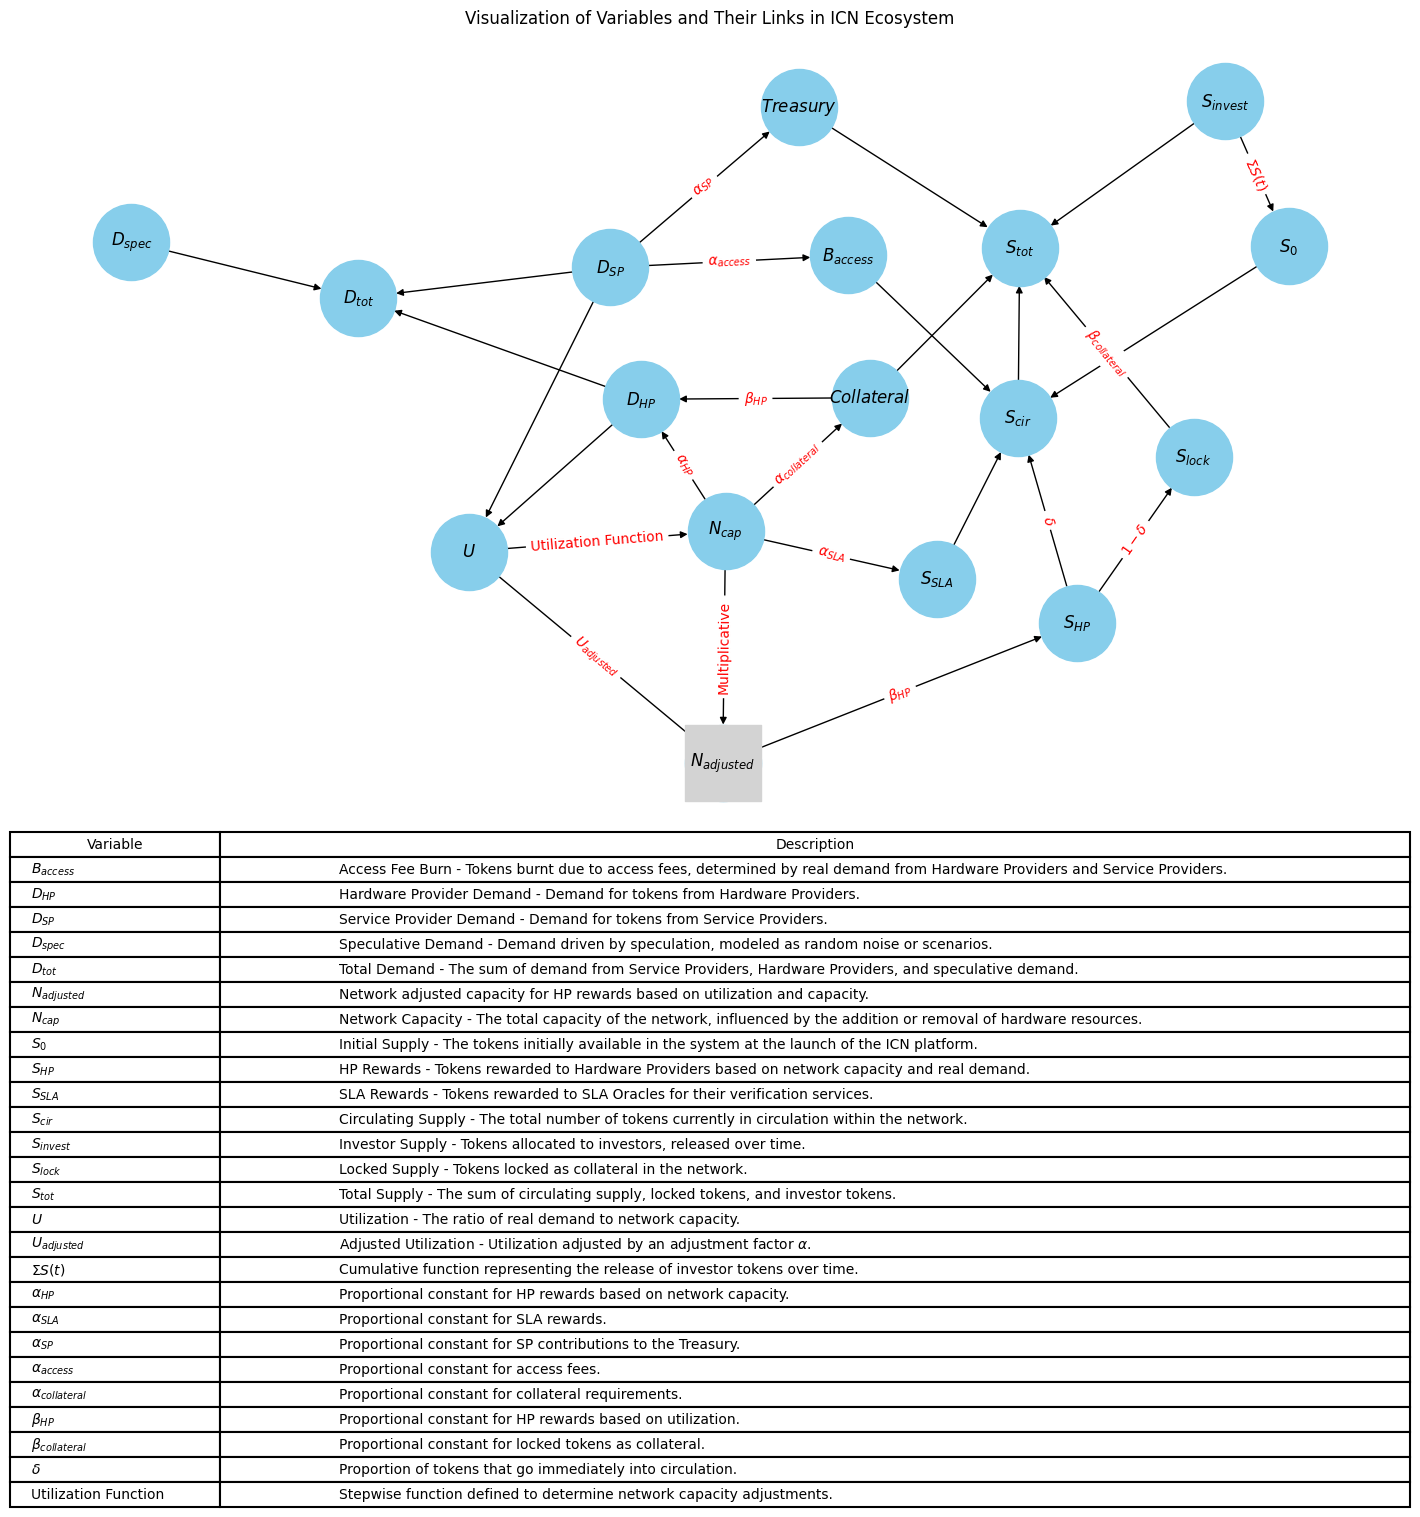
Token Supply, Demand and Capacity - Drafting ICN's First Predictive Model
A first predictive simulator linking emissions, capacity, utilization, and price to answer board-level questions about network design.
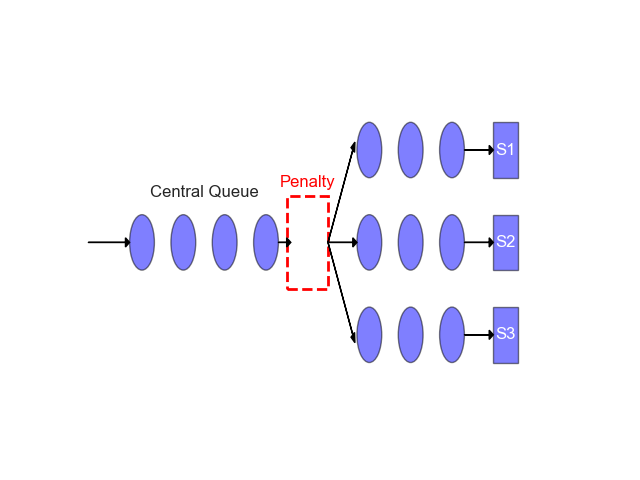
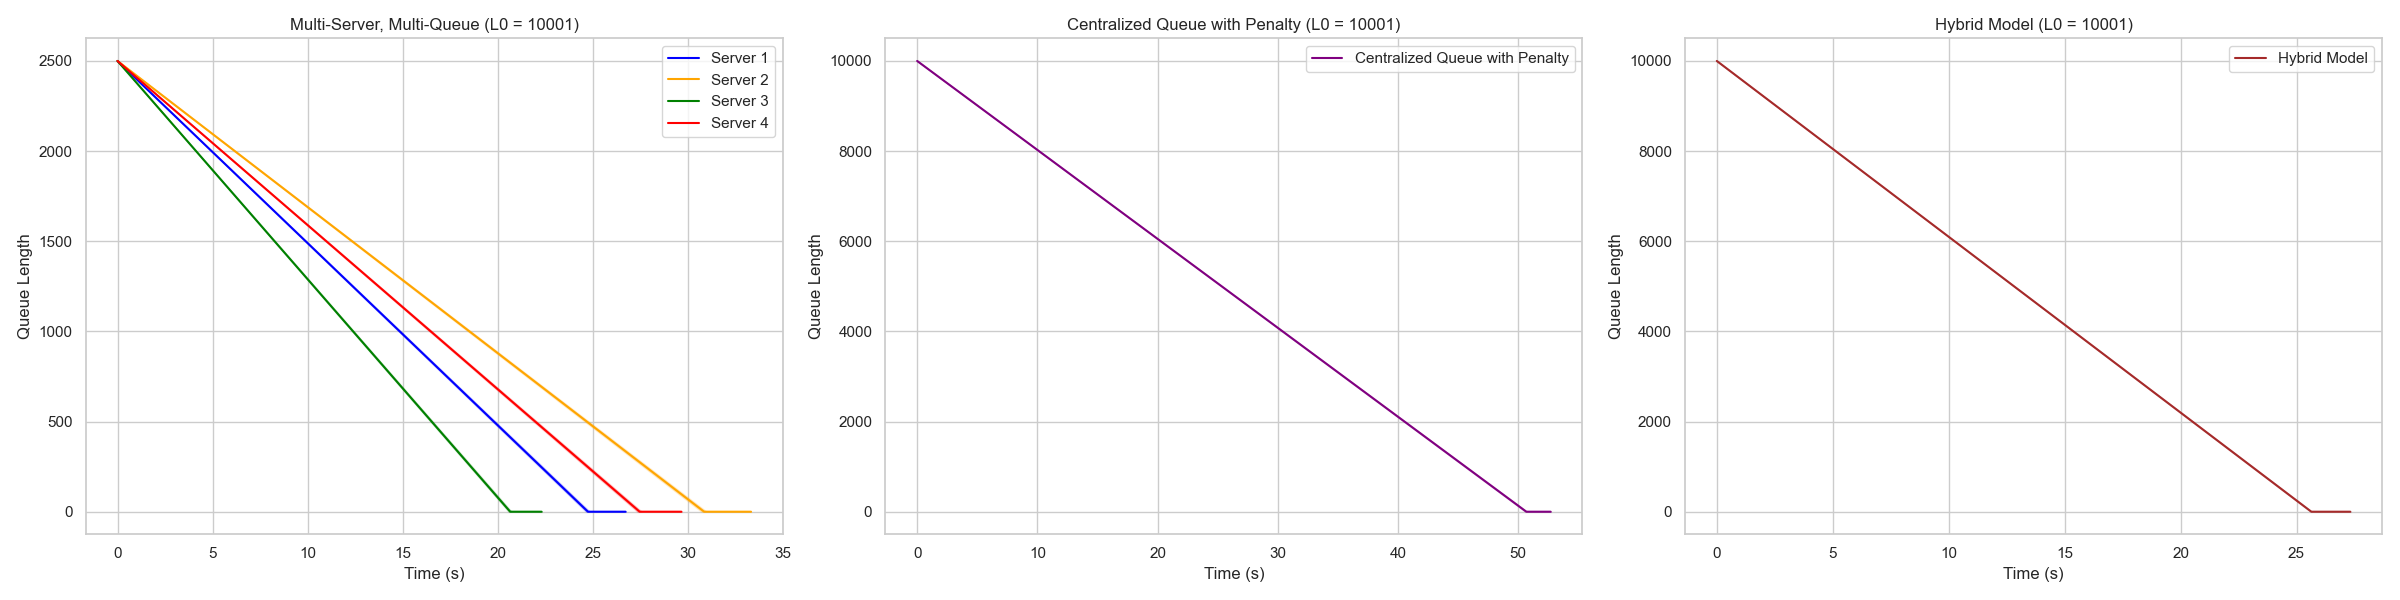
Optimizing Queueing Models in Server Systems
Using queueing theory to reason about throughput, wait times, and architecture tradeoffs instead of hand-waving about server efficiency.