Scraping the Android Paid Rank Charts
Introduction
Did you know that the mobile gaming industry is on track to surpass $100 billion in annual revenue? With such a vast ecosystem, the insights hidden within its data are as rich and diverse as the games themselves. This article delves into the heart of mobile gaming data, unraveling the trends and patterns that shape the experiences of millions of users worldwide.
We'll embark on a journey through the intricacies of data gathering in the mobile gaming sector, exploring the significance of user scores, download counts, and the dynamic pricing strategies employed by app developers. Our focus will be on how data not only reflects the current state of the mobile gaming market but also predicts its future trends.
By the end of this piece, you'll have a deeper understanding of the methodologies used to collect and analyze this data, the importance of such practices, and how they contribute to the ever-evolving landscape of mobile gaming. Whether you're a data enthusiast, a market analyst, or a gaming aficionado, the insights you'll gain here will equip you with a new lens through which to view the apps on your very own device. Welcome to a world where every download, every rating, and every price tag tells a story.
Background
In the ever-evolving digital age, the app market has witnessed exponential growth, particularly in the mobile gaming sector. With millions of apps available across various platforms, developers and marketers alike seek detailed insights into app performance, trends, and consumer preferences. This data becomes invaluable for making informed decisions, from marketing strategies to app development and optimization.
Context
The practice of web scraping for data collection has become a staple in the data science and analytics fields. It involves programmatically accessing web pages to extract specific data, bypassing the need for manual data entry or reliance on official APIs, which may not always be available or comprehensive. In the context of mobile apps, scraping app marketplaces like Google Play Store offers a treasure trove of data, including app rankings, reviews, installation numbers, and more. This information can reveal market trends, app popularity, and competitive insights that are crucial for app developers and marketers.
Relevance
Our focus on Android apps, specifically top-paid games, stems from the Android platform's massive user base and the lucrative nature of the gaming industry. As gaming apps constitute a significant portion of app revenue, understanding their performance across different markets can provide strategic advantages. Moreover, the landscape of app rankings and performance metrics is dynamic, with frequent changes influenced by consumer preferences, seasonal trends, and marketing efforts. Thus, continuous data gathering and analysis are essential for staying competitive and capitalizing on emerging trends.
In this digital era, where data is king, employing automated tools and techniques for efficient data gathering and analysis is not just advantageous but necessary. By leveraging web scraping through a robust and scalable solution like AWS Lambda, powered by Fivetran's scheduling capabilities, businesses can harness the power of real-time data analytics to drive decision-making and strategy development.
Challenges & Considerations
When embarking on the journey of scraping data from app marketplaces like the Google Play Store, especially for gathering insights on top-paid Android games across multiple countries, several challenges and considerations come to the fore. These not only relate to the technical execution of the task but also involve ethical and legal nuances that must be carefully navigated.
Problem Statement
The sheer volume and complexity of data available in app marketplaces pose a significant challenge. Each app's data encompasses various metrics, including rankings, user ratings, reviews, and price details. Compounded by the need to track these metrics across different countries, the task demands a robust and scalable approach to data collection and analysis. Ensuring data accuracy and relevance in real-time adds another layer of complexity, necessitating sophisticated data processing and storage solutions.
Dynamic Content and Anti-Scraping Measures
Web pages on the Google Play Store are highly dynamic, with content that frequently changes based on new app releases, updates, user reviews, and market trends. This dynamism requires scrapers to be adaptable and capable of handling real-time changes. Moreover, many websites employ anti-scraping measures to protect their data, ranging from CAPTCHAs to IP bans for suspicious activity. Navigating these barriers while maintaining efficient data collection processes poses a significant technical challenge.
Ethical/Legal Considerations
Respect for Copyright and Terms of Service
When scraping data from any website, it's crucial to respect copyright laws and the terms of service (ToS) of the website. Many sites explicitly prohibit scraping in their ToS, and ignoring these can lead to legal repercussions. It's essential to review and adhere to the legal guidelines set forth by the platforms being scraped to avoid potential legal conflicts.
Data Privacy Concerns
The collection and analysis of user-generated content, such as reviews and ratings, must be approached with a keen awareness of privacy issues. It's important to ensure that data handling practices comply with global data protection regulations, such as GDPR in Europe and CCPA in California, which set strict guidelines on personal data usage. Anonymizing and aggregating data to protect individual privacy is a critical step in this process.
Ethical Use of Scraped Data
Finally, the ethical implications of how scraped data is used cannot be overstated. Data should be employed to generate insights and make informed decisions that contribute positively to the app ecosystem, rather than to manipulate rankings or engage in unfair competitive practices. The goal should always be to add value to users and stakeholders in the app marketplace.
Methodology
The methodology for scraping top-paid Android games across various countries from the Google Play Store involves a combination of tools and technologies, along with a systematic approach to data collection, processing, and analysis. Below, we detail the components of this methodology, including the tools used, a step-by-step guide to the scraping process, and share insights on best practices gleaned from the experience.
Tools & Technologies
- Python: The core programming language used for scripting the scraper. Python's rich ecosystem of libraries makes it an ideal choice for web scraping and data processing tasks.
- BeautifulSoup: A Python library for parsing HTML and XML documents. It is used for extracting data out of HTML files, making it easier to navigate and search the parse tree.
- Requests: A Python library used to send HTTP requests easily. It's employed to fetch the web pages from the Google Play Store for scraping.
- Pandas: Utilized for data manipulation and analysis. It provides data structures and operations for manipulating numerical tables and time series, ideal for handling the data extracted from web pages.
- Selenium: A tool for automating web browsers. Selenium can simulate user interactions with web pages, which helps in scraping dynamic content that requires interaction like clicking buttons or filling forms.
Step-by-Step Guide
-
Setting Up the Environment:
-
Install Python and the necessary libraries (beautifulsoup4, requests, pandas, selenium) using pip:
conda install beautifulsoup4 requests pandas selenium - Ensure you have a WebDriver (e.g., ChromeDriver for Google Chrome) installed to use with Selenium.
-
Install Python and the necessary libraries (beautifulsoup4, requests, pandas, selenium) using pip:
-
Fetching Web Page Content:
- Use the requests library to send an HTTP GET request to the URL of the Google Play Store's top-paid games section for the specific country.
- For dynamic content, utilize Selenium to automate browser interactions to load the webpage fully before scraping.
-
Parsing the HTML Content:
- Load the HTML content into BeautifulSoup for parsing:
                                                from bs4 import BeautifulSoup

soup = BeautifulSoup(response.text, 'html.parser') - Identify and extract the necessary data points (e.g., game name, rank, price) using BeautifulSoup's search methods.
-
Data Extraction and Storage:
- Organize the extracted data into a structured format using Pandas DataFrames. This step facilitates easier manipulation and analysis of the data collected.
- Save the DataFrame to a CSV file for further analysis or reporting:
df.to_csv('top_paid_games.csv', index=False) -
Repeat for Multiple Countries:
- Modify the base URL or parameters to target the specific country version of the Google Play Store.
- Automate the process to cycle through a list of countries, repeating steps 2-4 for each.
Tips & Best Practices
- Respect Robots.txt: Always check and adhere to the robots.txt file of any website you're planning to scrape. This file outlines the areas of the site that are off-limits to scrapers.
- Rate Limiting: Implement delays between your requests to avoid overwhelming the server or getting your IP address banned.
- Error Handling: Incorporate robust error handling to manage issues like network problems or unexpected webpage structure changes gracefully.
- Data Privacy: Ensure you're compliant with data protection laws by anonymizing any personal data and using the data ethically.
- Scraping Ethics: Consider the impact of your scraping on the website's resources and strive to minimize it. Use APIs if available, as they are often a more efficient and approved method of accessing data.
Results
Findings
The data gathered from the web scraping project provides a comprehensive overview of the top paid games on the Android market across multiple countries. The visualizations derived from this data offer significant insights:
-
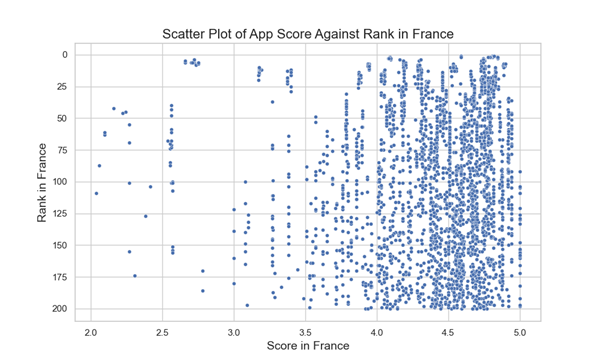
Scatter Plot of App Score Against Rank in France:
The scatter plot reveals that higher-ranked games tend to have higher scores, indicating that quality, as perceived by users, correlates with a game's success in terms of rank.
-
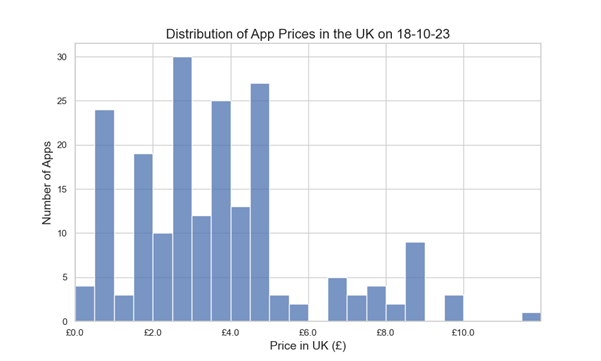
Distribution of App Prices in the UK:
This histogram shows the price distribution of top paid games, highlighting that most games are priced in the lower to mid-range bracket, with fewer games at higher price points.
-
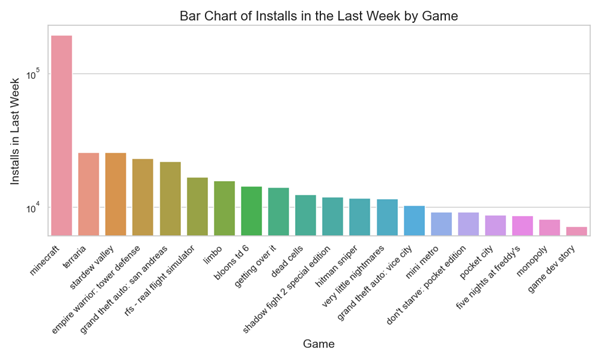
Bar Chart of Installs in the Last Week by Game:
Here we see a clear demonstration of Benford's Law, where the number of installs for top games shows a logarithmic distribution, with fewer games having very high install numbers.
-
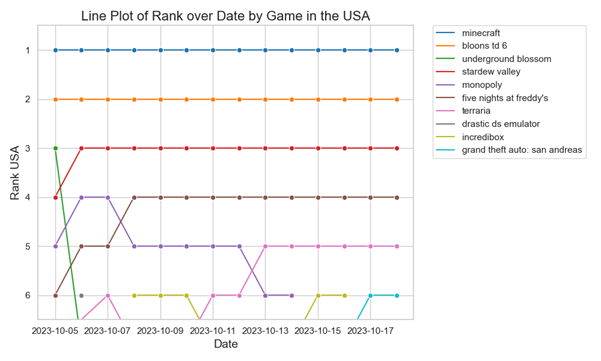
Line Plot of Rank over Date in the USA:
This line chart tracks the rank of top games over time, showing relative stability in rankings with some fluctuations that could indicate promotions, updates, or changes in user preferences.
Analysis
The correlation between app scores and rankings in France suggests that users' perceptions significantly impact a game's success, a trend likely mirrored in other markets. High scores can result from effective marketing, strong gameplay, and positive user experiences, all of which are essential factors for developers to consider.
The price distribution in the UK indicates a market tendency toward more affordable games, with developers potentially finding a sweet spot for pricing that maximizes both revenue and user acquisition. This suggests that while premium games can succeed, there's a stronger market for games with a lower financial barrier to entry.
The installs data conforming to Benford's Law is particularly interesting. This mathematical principle often applies to naturally occurring datasets and suggests that the scraping methodology and data extraction processes are accurate, reflecting realistic install trends.
Rank stability in the US, with some notable exceptions, can be indicative of a mature market where top games maintain their positions unless significant events occur. These could include seasonal trends, sales, or major updates, which can cause temporary shifts in rankings.
Surprises
The adherence to Benford's Law in the install data was an intriguing find, as it's not always observable in manually curated datasets. This supports the robustness of the web scraping approach in capturing a natural distribution of user behaviour.
The stability of rankings over time with few significant fluctuations was somewhat unexpected. This may imply a level of market saturation where top games are solidified in their positions, making it challenging for new entrants to break into the top ranks.
Conclusion
Summary
The journey of scraping data for top-paid Android games across multiple countries has been a meticulous process, leveraging a suite of powerful tools and adhering to a structured methodology. By harnessing Python, BeautifulSoup, and Pandas, we've systematically extracted, parsed, and analysed data from the Google Play Store. The resulting visualizations - scatter plots, histograms, bar charts, and line plots - have not only illustrated the current state of the market but have also showcased trends and behaviours in app rankings, user ratings, pricing strategies, and install numbers.
Implications
The findings from this data scraping project reveal crucial implications for developers and marketers in the mobile gaming industry. Quality and user perception, as reflected in app scores, are closely tied to a game's rank and visibility. Pricing strategies need to strike a balance between profitability and accessibility to maximize market penetration. The consistency of installs following Benford's Law reassures us of the natural and unmanipulated nature of the data gathered, endorsing the validity of our scraping approach.
The methodology used here, while focused on the Android market, is significant for its adaptability and potential application across various digital marketplaces. The tools and techniques employed can be replicated and tweaked to fit different platforms and data structures, providing a versatile framework for web data extraction.
Future Directions
Looking ahead, this scraping model can be expanded in several directions. An immediate extension could be the analysis of free Android apps, which would provide insights into how different monetization strategies impact app performance and user engagement. Moreover, exploring specialized sub-categories within the paid and free segments could uncover niche trends and opportunities.
Although data availability on the Apple App Store is more limited, developing innovative scraping strategies to gather what data is available would be a valuable endeavour. Additionally, leveraging APIs from other digital marketplaces like Steam could provide rich datasets for analysis. The Steam API, for example, could be utilized to understand trends in the PC gaming market, offering a comparison point to mobile gaming data and potentially informing cross-platform development strategies.
By continuing to adapt and apply this methodology, there is a vast potential to uncover deeper insights into the digital app market, enabling stakeholders to make data-driven decisions that align with user behaviours and market trends.
Call to Action
As we reach the conclusion of this exploration into data scraping and analysis of the top-paid Android games, it's your turn to dive into the data ocean. Whether you're a data enthusiast, a mobile game developer, or simply curious about the digital marketplace:
- Engage: We'd love to hear your thoughts on this study. Have you conducted similar projects? What challenges have you faced, and what insights have you discovered? If you're just starting, what questions do you have, and how can the community assist you? Your experiences and queries enrich the conversation and foster a community of shared learning.
- Share: If you found this analysis insightful, consider sharing it with peers who might benefit from it. Whether it's within your professional network or in educational settings, spreading knowledge is key to collective advancement.
- Experiment: Encourage readers to use the methodology and code snippets provided to conduct their own analysis. Perhaps there's a specific segment of the app market you're interested in, or you might want to compare these findings with iOS apps or another platform.
Links
For further reading and resources, consider exploring the following:
- Documentation for BeautifulSoup : Gain a deeper understanding of the tools used in this project by visiting the official documentation for BeautifulSoup.
- Documentation for Pandas : Explore the extensive functionalities of Pandas for data manipulation and analysis.
- Documentation for Matplotlib : Learn more about Matplotlib, a comprehensive library for creating static, animated, and interactive visualizations in Python.
- Related Articles on Towards Data Science : Expand your knowledge by reading articles on similar topics.
- Kaggle : Dive into community-driven content on data scraping and analysis projects.
- Coursera : If you're looking to get hands-on with data scraping and analysis, check out the courses ranging from beginner to advanced levels.
- edX : Another excellent platform offering a variety of courses on data scraping and analysis.
- Udemy : Udemy provides a wide range of courses on data science topics, including data scraping and analysis.
By engaging with the community, sharing your findings, and exploring further resources, you contribute to a larger dialogue about the importance of data in understanding and shaping the digital marketplace. We invite you to continue the exploration and look forward to your contributions to this ever-evolving field.
