1. Problem
Unlock schedules are often discussed as if the shape is obvious, but small changes in timing, tranche size, and allocation mix can change sell pressure dramatically. The team needed a scenario surface, not a static vesting table.
2. Approach
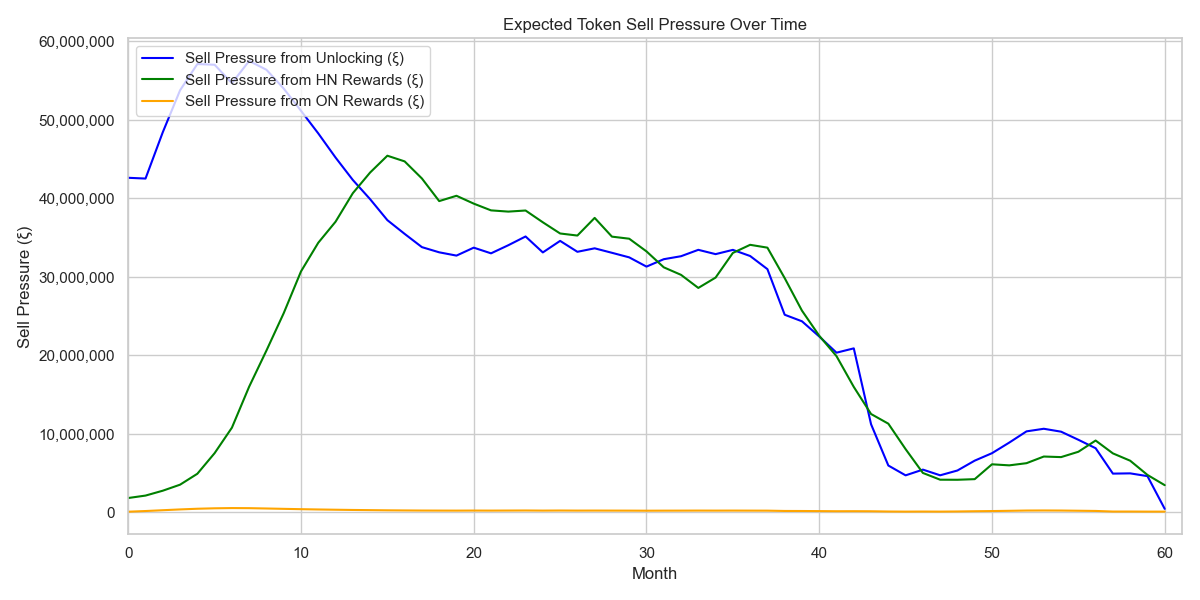
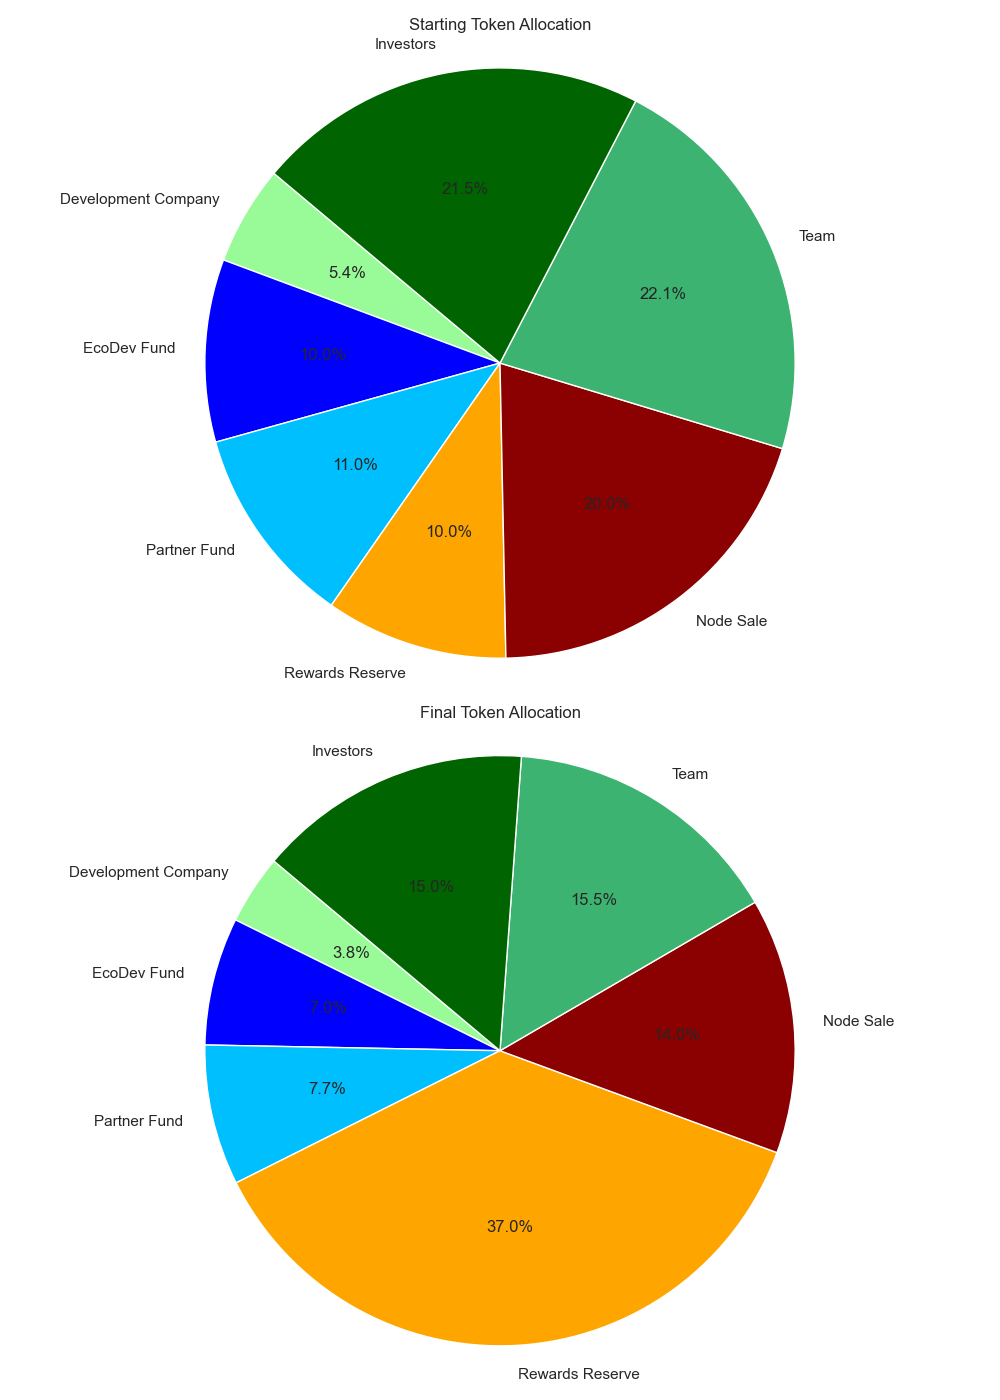
I built a compact simulator that crossed multiple unlock patterns and supply assumptions so the downstream effects on price pressure and allocation behavior could be compared quickly.
- Model multiple schedule shapes rather than arguing about one preferred option.
- Translate schedules into comparable pressure and allocation views.
- Keep the tool lightweight enough for rapid governance discussion.
3. Evidence
4. Outcome
The simulator gave the team a fast way to compare alternatives and made vesting design more defensible because the scenarios could be challenged explicitly.
5. Tech stack
- Python simulation scripts
- Pandas and NumPy for scenario handling
- Matplotlib for communication-friendly charts
6. Useful links
7. Related reading
8. Call to action
If your token, incentive, or vesting design still lives in a static spreadsheet, I can help turn it into a scenario model people can pressure-test.