1. Problem
A forecast can look acceptable on one headline metric and still be operationally dangerous. Teams need a way to decide whether a model is safe to ship, not just statistically convenient to present.
2. Approach
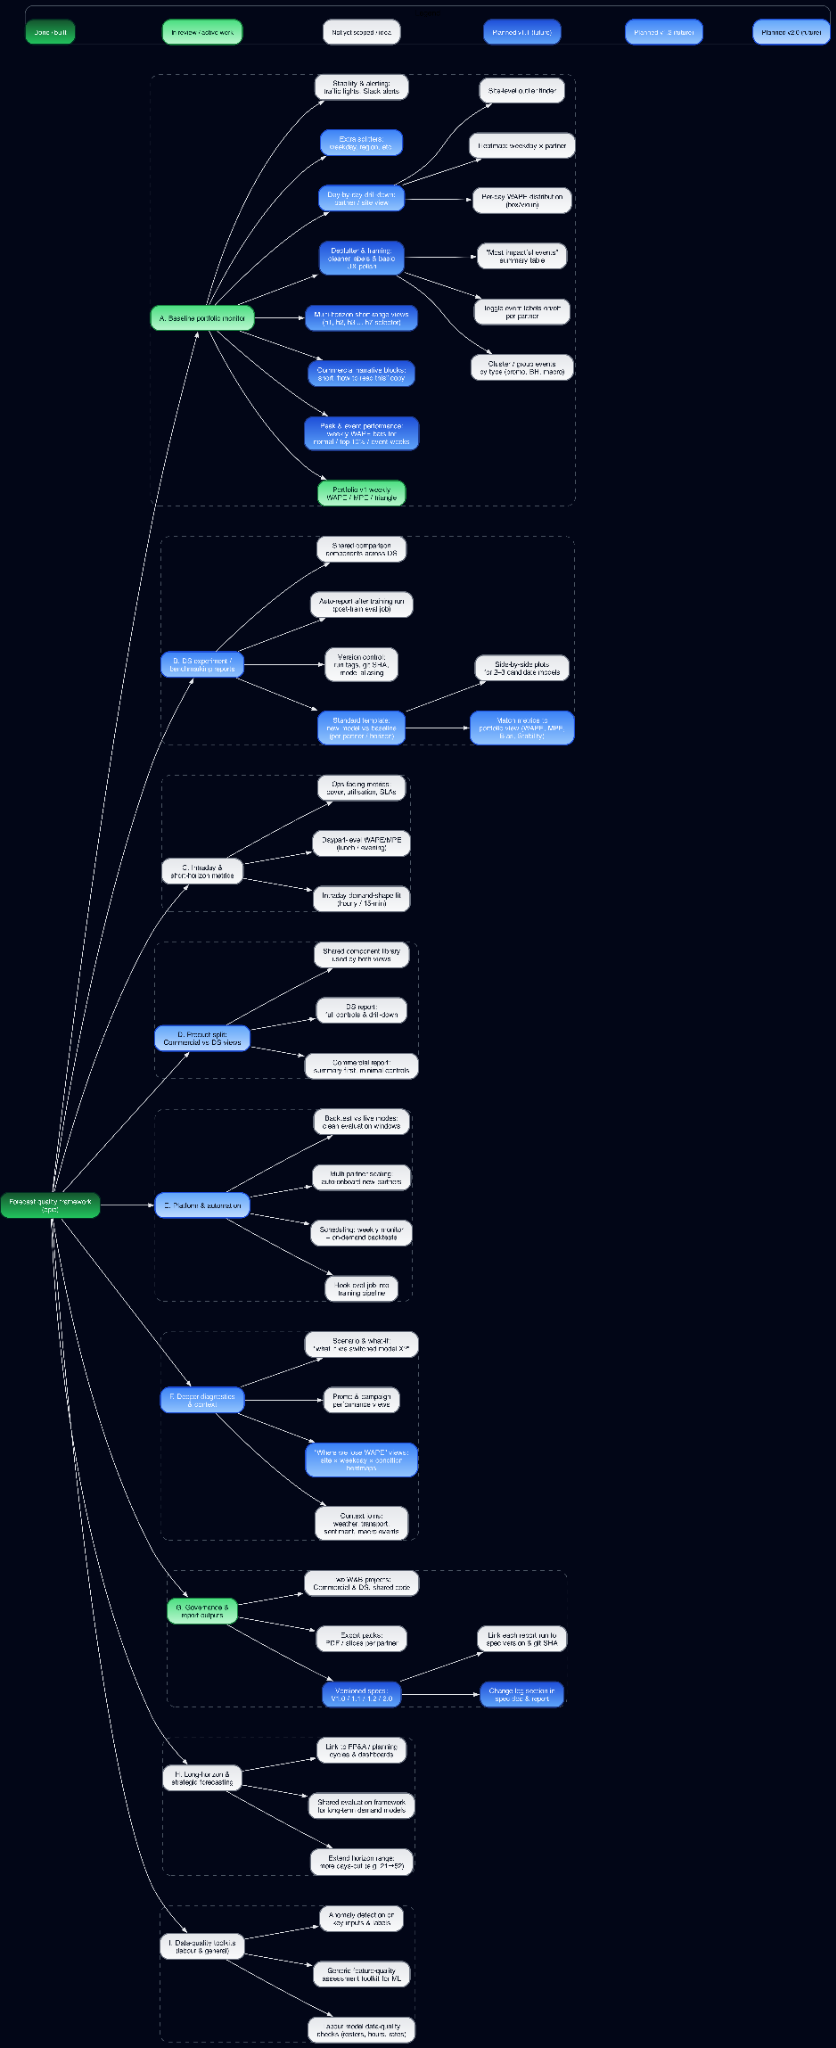
I defined forecast quality as a small set of auditable axes tied to failure modes: accuracy, bias, stability, tail robustness, and peak behavior.
- Keep the metric set small enough to explain.
- Tie each metric to a real operational failure mode.
- Start with a thin-slice evaluation surface before building a platform.
3. Evidence
4. Outcome
The framework made it much easier to compare models honestly and explain tradeoffs to commercial stakeholders who did not care about a metric zoo.
5. Tech stack
- Python evaluation scripts for metric computation
- Thin-slice reporting with quick plots and scorecards
- Experiment tracking and artifact comparison
6. Useful links
7. Related reading
8. Call to action
If your team is still shipping forecasts off a single error metric, I can help design an evaluation surface that reflects operational reality.