A lead is not a position
Two players can face the same score with very different prospects. One has an open red and a route to the colours. The other is tight against a cushion, looking at a blocked path. A scoreboard treats those situations alike. Anyone watching the table knows they are not.
That became the next question after the September work on perception errors: once a broadcast image becomes a usable table state, how much does that state add to a forecast? I wanted to measure the contribution of the layout, rather than decorate a score-based probability with convincing graphics.
My work connected shot-state extraction, geometric features, frame-outcome labels, grouped evaluation and a replay that makes the result visible. Each part has a separate job. The detector locates balls; the score bar provides context; the evaluator estimates the frame outcome. Keeping those responsibilities distinct made it possible to test where the extra information actually helped.
Follow a frame that turns around
The recorded example follows Neil Robertson against Stuart Bingham at the 2025 Players Championship. Bingham leads the match 4–3. Robertson falls 29–66 behind in the eighth frame, needs snookers, and eventually wins 67–66 on the black. It is a compact story with a clear question: when does the position become recoverable?
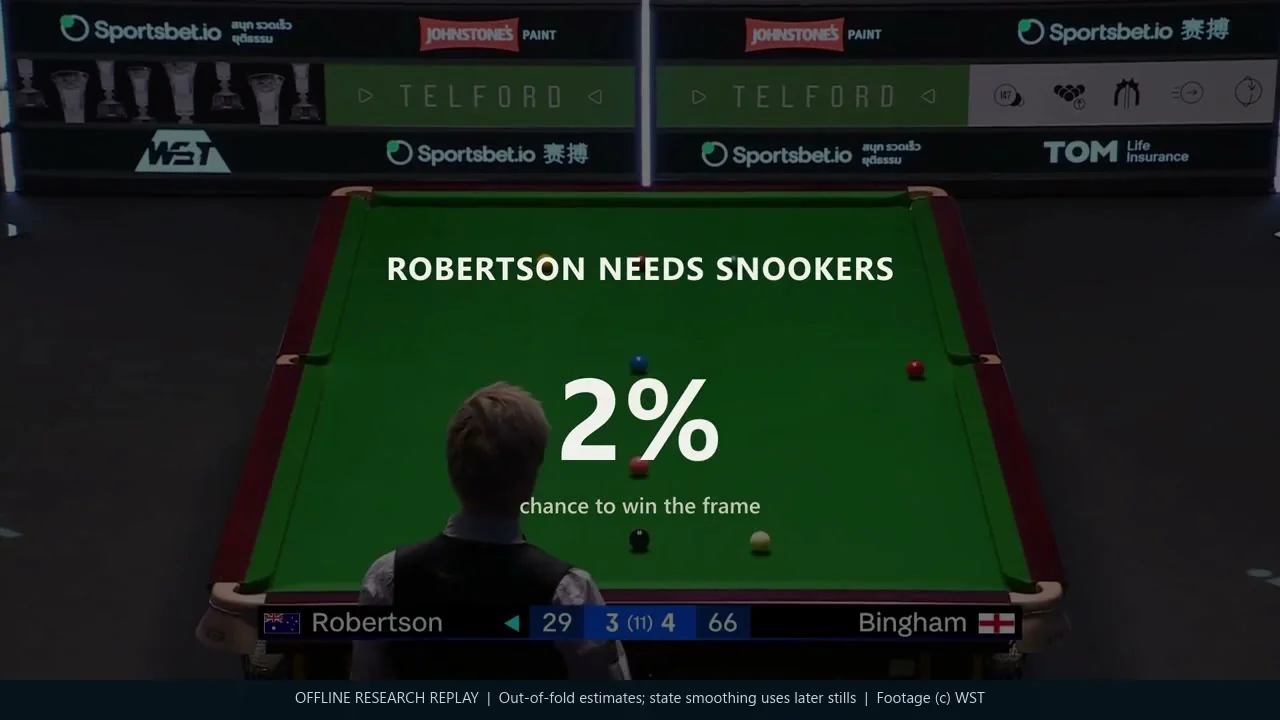
A short explanation sequence stops at one position and walks through the evidence: the captured still, ball detections, score-bar reading and top-down geometry. The white is tucked behind the blue, with its route to the brown blocked. Showing that chain is more useful than asking the viewer to trust a changing percentage.
The predictions are out of fold: the model scoring this match did not train on its match group. This is an offline research replay, selected because the comeback explains the idea well. Some state reconstruction uses information from later stills within the frame. It therefore demonstrates the representation and model behaviour, rather than a strictly online forecasting service or a typical result.
Turn pictures into a question the model can answer
The pipeline selects useful observations around shots, rather than treating every video frame as a new example. It combines camera geometry, ball classes, the score and the player to move. The resulting state describes what is left on the table and which opportunities are available.
The score-only baseline already knows a great deal: the lead, points remaining, phase and whose turn it is. The layout adds line of sight, possible pots, cue-ball proximity to cushions and the arrangement of the reds and colours. These are approximate geometric features. They do not simulate spin, cushion play or the full quality of a safety shot.
Outcome labels needed equal attention. A late or missed frame boundary can attach the next frame’s opening positions to the previous winner. I used score resets and changes in frames won to repair those boundaries and retained explicit reasons for excluding incomplete or heavily edited sequences. A sophisticated model cannot rescue a comparison whose targets have been assigned to the wrong frame.
This is where the earlier label work connects to forecasting. A missed colour changes the estimated points available; an uncertain turn changes the interpretation of an open pot. The useful unit is a reviewable state with its source evidence, not a collection of detections considered separately.
Measure the added information
The figures here use one frozen research snapshot, taken on 22 October 2026. It contains 129,451 source stills from 457 videos; the scored population is 77,885 eligible positions across 2,067 frames. Those positions share frame outcomes, so they are not 77,885 independent matches.
Evaluation holds out whole match groups. Videos belonging to the same match, or the same pair of players, stay together. Every reported prediction comes from a model that did not train on that group. Comparisons use the same positions, and uncertainty is estimated by resampling whole matches.
A random split of stills would give a much easier test. Near-identical positions from the same frame could appear on both sides, along with the same players, camera and eventual outcome. Grouping sacrifices some apparent precision, but it asks the question the product needs answered: can the relationship survive a different match?
I compared score-only models with versions that also see the layout and the current visit. The evaluation target is the chance that the player to move wins the frame; the replay converts that estimate into each named player’s chance. Log loss measures how well the probabilities describe the outcomes: lower is better, and confident wrong forecasts are costly. It is a more useful test here than counting how often the favourite wins.

The score-only trees record log loss of 0.4799. Adding layout lowers it to 0.4710; adding visit information as well reaches 0.4698. The paired layout improvement is 0.0089 nats per position, with a 95% match-bootstrap interval of 0.0074–0.0106. That is evidence for an incremental contribution, not a claim that the layout explains most of the game.
Its practical effect is easier to see in probabilities. Layout changes the score-only estimate by 4.4 percentage points on average, and by more than ten points at 11.5% of positions. Those are differences between model estimates, not guaranteed improvements of that size on each shot.

The colours phase shows the largest gain. During safety exchanges, layout also helps damp the score-only model’s tendency to swing with every change of turn. Being at the table is valuable when a pot is available; it means something different when the incoming player is snookered.
A percentage should mean something
A useful probability needs more than a persuasive curve. Across positions assigned roughly the same chance, outcomes should occur at about that rate. The calibration plot compares average predictions with observed frame wins in ten probability bins.

The score and layout versions broadly follow the diagonal. That supports using probabilities to explain the replay, while leaving room for uncertainty in individual positions. A model can be calibrated in aggregate and still misread a specific state because a ball is missing, the turn is wrong or the camera geometry is poor.
I also compared explicit geometric features with a set/attention network over the balls. The network found useful layout signal but did not beat the feature-based trees in this experiment. It received limited tuning, so this is not a verdict on the architecture. It is a reason to keep the stronger, simpler reference while testing what a more complex model adds.
Make the research usable
The delivery challenge was to connect a technical comparison to something a viewer could inspect. I kept the probability panel secondary to the play, used captions at the important swings and made the extraction sequence visible at a moment where geometry matters. The replay should explain the work without turning every shot into a dashboard.
Behind that presentation, the important product choices were about evidence: preserve the observation, identify the source of each field, distinguish a measured state from a reconstruction, and keep the forecast separate from the detector. That makes a failure easier to investigate and a future interface easier to build.
It also gives the research a stopping rule. The immediate aim was to establish whether table layout contributes beyond the score and whether the contribution can be communicated clearly. The retained experiment answers that narrower question. Continuous tracking, shot recommendation and live delivery each need their own tests.
Test the next version on its own terms
The dataset and code continued to change after this snapshot, including canonical-game filtering and additional calibration work. The next evaluation should freeze those inputs again, preserve the earlier comparison and report what changed on a matched population. A larger current dataset should not quietly inherit an older result.
The next product test is a strictly causal replay: use only information available at each observation, then inspect errors across different cameras, events and players. A separately reviewed outcome sample would strengthen the generated labels. Those steps will establish how much of the offline result survives the conditions a live system would face.
Evidence: frozen 22 October 2026 evaluation; five-fold match-grouped predictions and 1,000 whole-match bootstrap resamples. Outcomes are generated from broadcast evidence. Charts, definitions and rounded calibration bins are retained in the public evidence snapshot.
Keep exploring
Explore predictive modelling · All sports intelligence writing