Computer vision · Sports data · Product leadership
From pixels to table state
A snooker computer-vision proof point designed as a trustworthy data product: calibrate the table, resolve ball state, expose uncertainty and make the output legible to both technical reviewers and commercial stakeholders.
A vertical product slice from raw frame through QA and stakeholder-facing output.
Executive takeaway
Build the evidence chain, not the demo.
The useful product is not a bounding box. It is a reliable path from a changing broadcast view to a normalized table state that can support annotation, benchmark design, shot analysis and future probability features. I scoped the first proof point around that foundation and made every stage reviewable.
Start with the stable layer
Ball identity, position and state come before tactics or prediction. That kept the first contract narrow enough to evaluate and broad enough to unlock later products.
Normalize the world
A table homography converts image pixels into regulation-table coordinates. Downstream logic can then reason about the game rather than one camera angle.
Treat uncertainty as workflow
Hard cases, occlusions, inventory conflicts and unsafe refinements are routed into QA instead of being hidden behind an aggregate score.
System
From frame to decision signal.
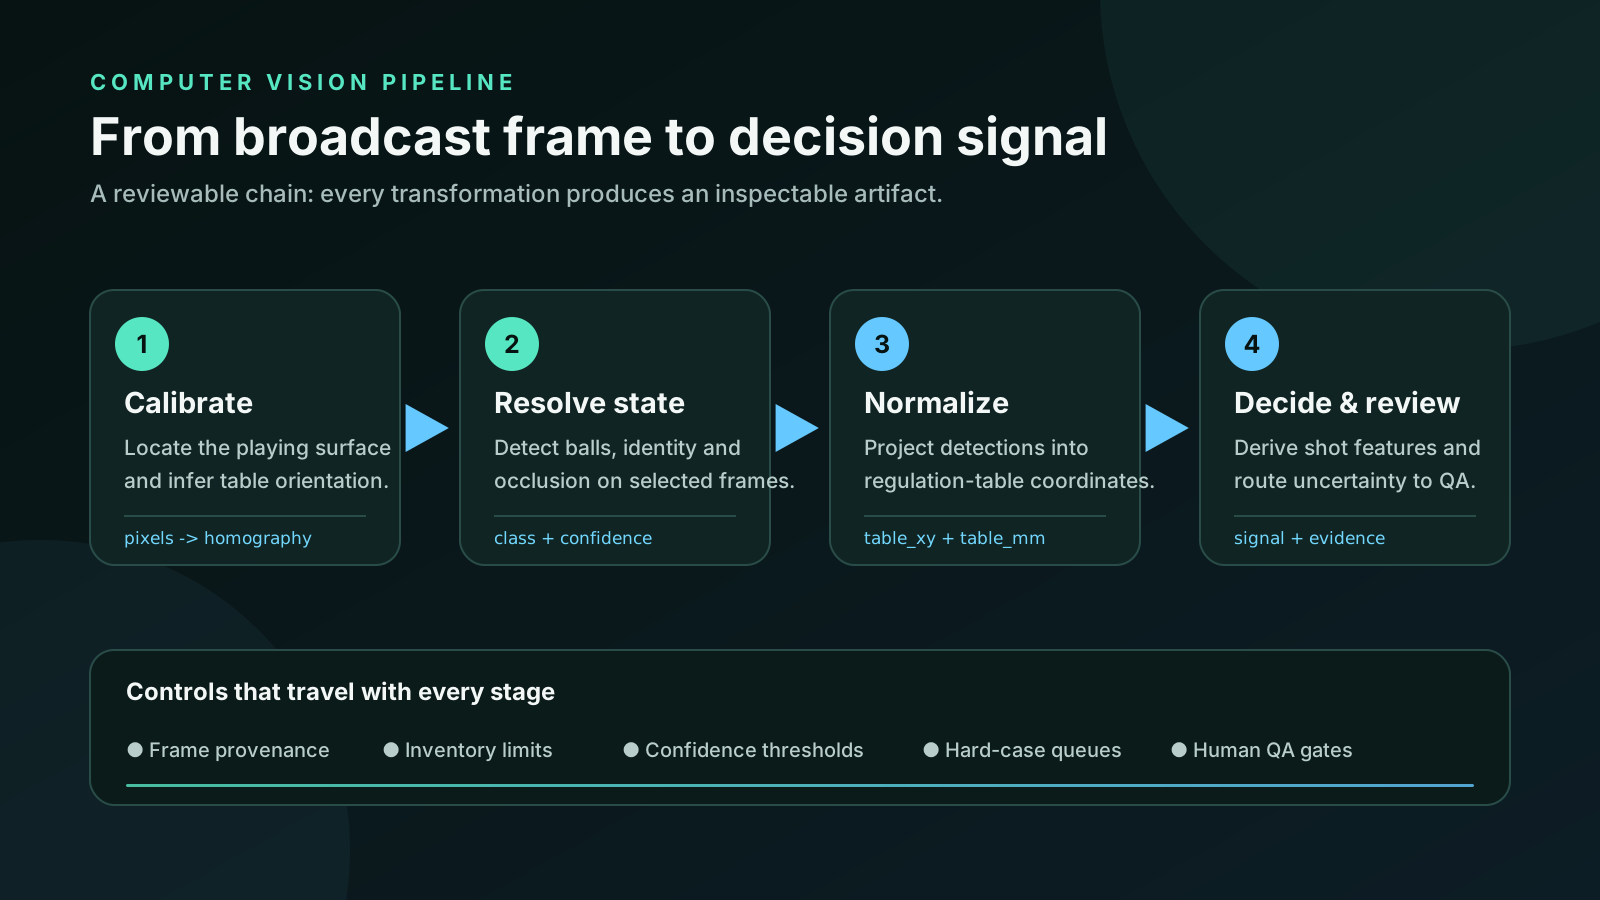
The system separates perception from game logic. Frames are calibrated to the playing surface; candidate balls are detected and classified; coordinates are projected into normalized and millimetre space; and derived features can then be built on a consistent representation. Provenance and QA status stay attached throughout.
Calibrated coordinates
Map each table to a regulation playing surface so position means the same thing across crops, zooms and broadcast layouts.
Inventory-aware cleaning
Merge duplicates, reject off-table candidates and apply snooker inventory constraints before labels reach training or scoring.
Static-frame proof first
Establish a dependable table-state layer before adding temporal tracking, rules state and higher-order shot models.
Demonstration
Make the pipeline visible.
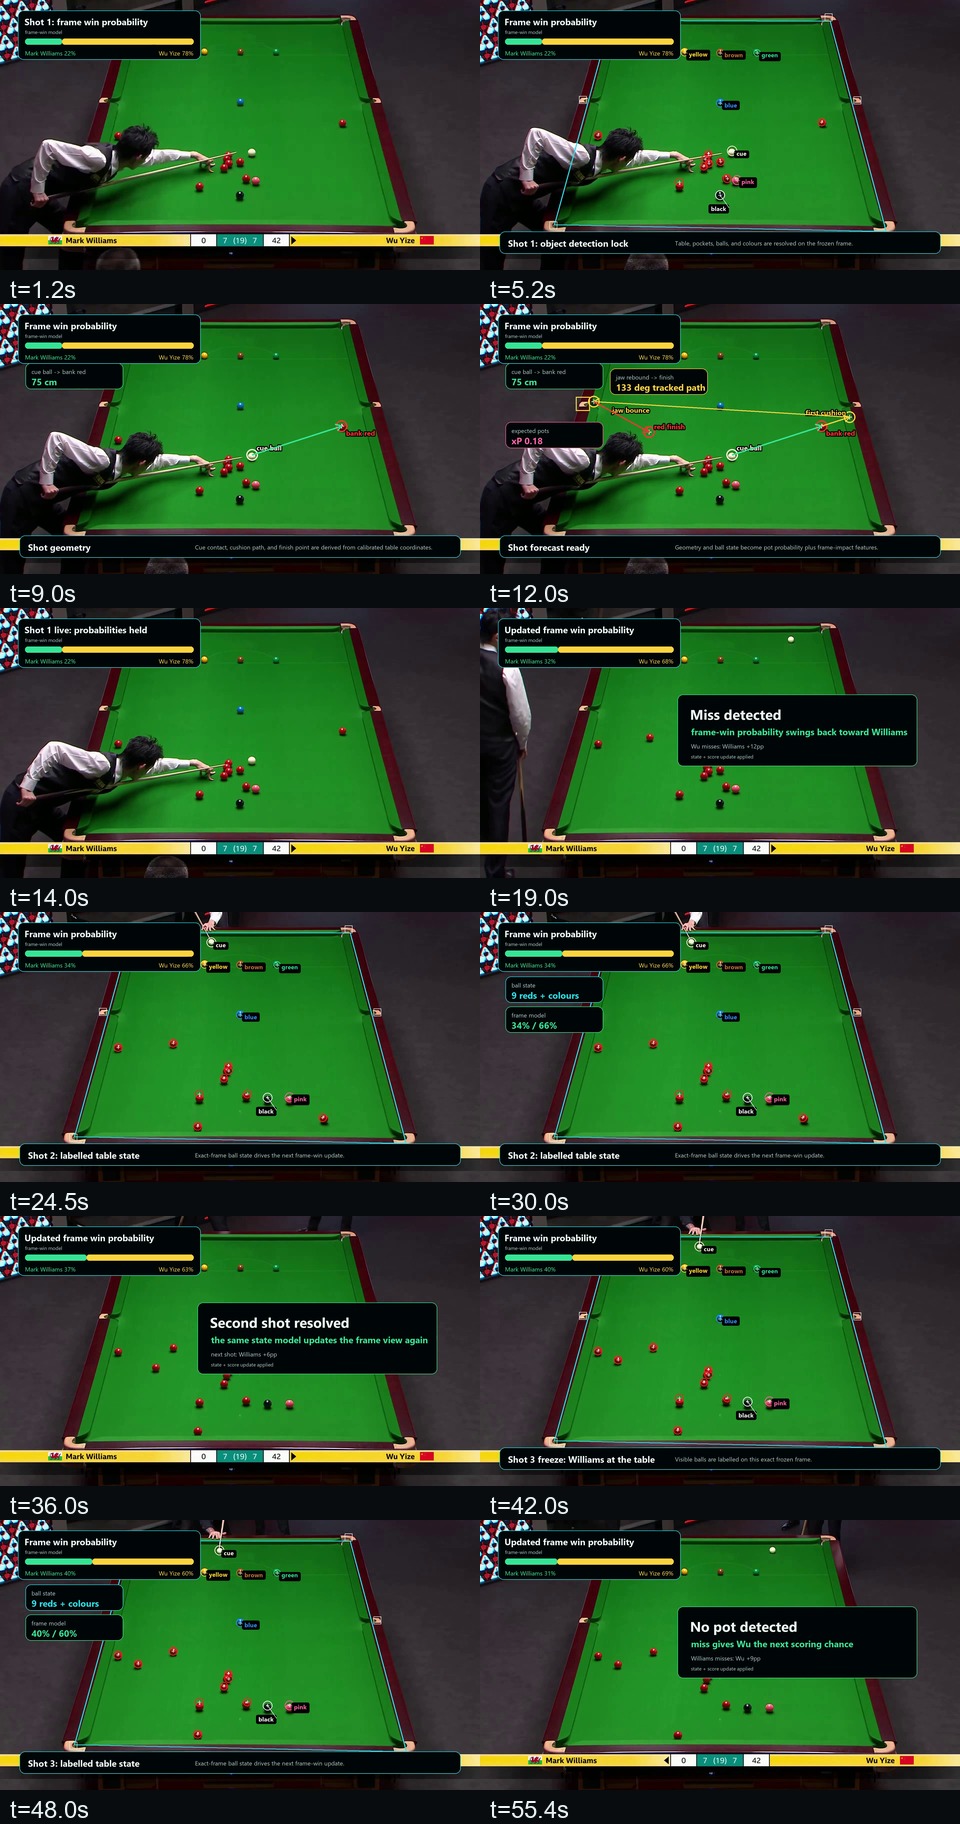
The annotated demo is a product communication object, not a claim that every overlay is production validated. It shows how calibrated ball state could feed shot geometry, event resolution and frame-level probability features in a form that stakeholders can challenge.
Watch and share the snooker demo on its dedicated video page.
Read the visual sequence
- The first frame locks the table, pockets and visible balls.
- A banked-red path is drawn from cue contact through cushion contact to the finish point.
- The post-shot table state is resolved and the illustrative frame signal changes.
- Two later states repeat the freeze, label, resolve and update pattern.
Evaluation & QA
Show what the evidence can—and cannot—support.
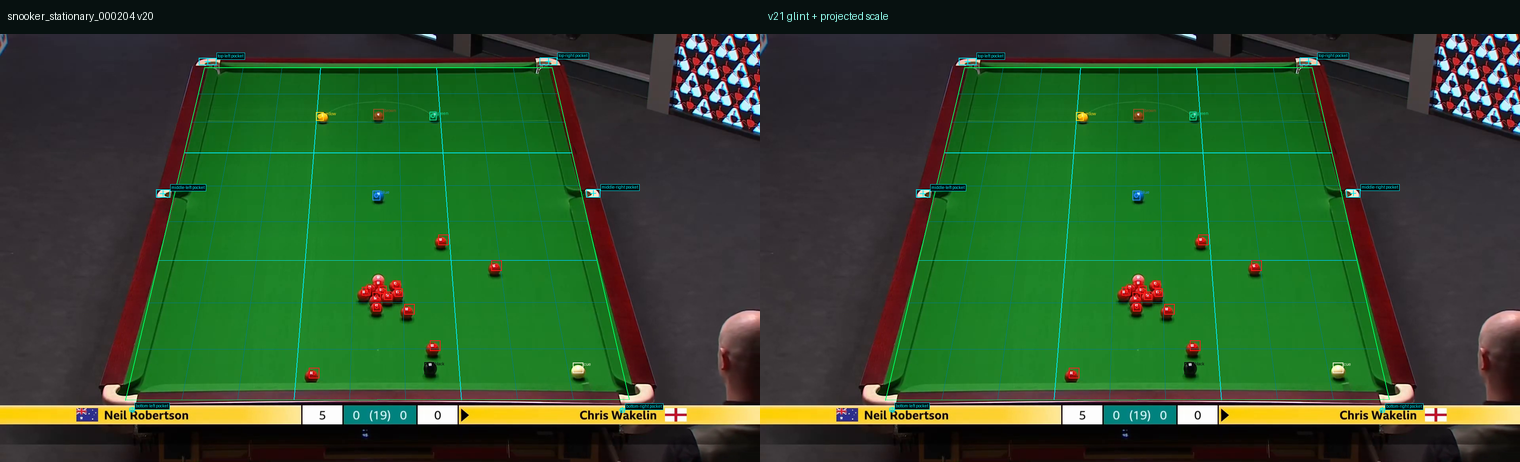
The annotation loop uses calibrated perspective and highlight evidence to improve candidate centres, then automatically rolls back unsafe frame-level refinements. Triage separates clean passes, review candidates and high-severity conflicts so human effort lands where it adds the most value.
A held-out baseline proves the local end-to-end loop and creates a stable comparison point. Its purpose is engineering direction, not marketing theatre: challenge-grade claims wait for an independently reviewed and locked reference set.
Automated guards
Catch structural failure
Off-table centres, duplicate detections, impossible inventories, missing colours and risky cluster refinements create explicit review signals.
Visual review
Inspect the geometry
Overlays and before/after sheets expose whether a numerically small adjustment is visually correct in dense red clusters.
Promotion gate
Separate prefill from truth
Human centre review, red-count reconciliation, calibration checks and anti-leak review are required before a hidden scoring set is promoted.
Outcome & lessons
A proof point built to become a benchmark.
The work produced a stakeholder-ready demonstration, a calibrated annotation pipeline, a versioned prefill pack, inspectable QA artifacts and an evaluation baseline. More importantly, it made the next investment decisions concrete: where human review adds value, which classes need targeted data, and when temporal modelling becomes worthwhile.
- Design the coordinate system before the clever feature. Stable table coordinates make future tracking and game-state logic far easier to reason about.
- Hard cases are a product surface. A useful review queue often creates more value than another opaque point of aggregate accuracy.
- Label the metric’s authority. A pseudo-label holdout is an engineering baseline; it is not the same evidence as locked, independently reviewed ground truth.
- Demonstrations should expose the contract. Showing the chain from detection to decision lets commercial and technical teams discuss the same system.