Note: this is an unofficial fan-made tool. It is designed for reasoning about probability scenarios, not for asserting official event odds or guarantees.
1. Problem
Loot-box style systems are hard to think about because intuition is terrible at compounding probabilities. People remember anecdotes, not distributions. I wanted a tool that made the odds, pity logic, and expected values visible enough to support an informed decision.
2. Approach
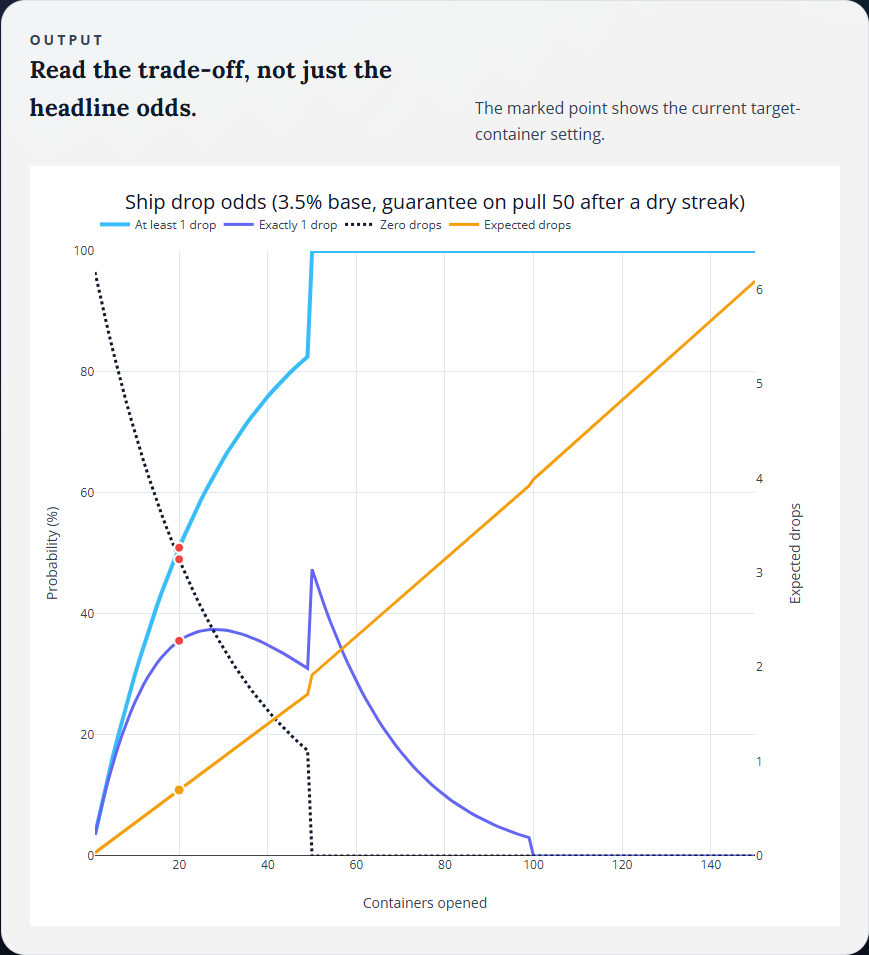
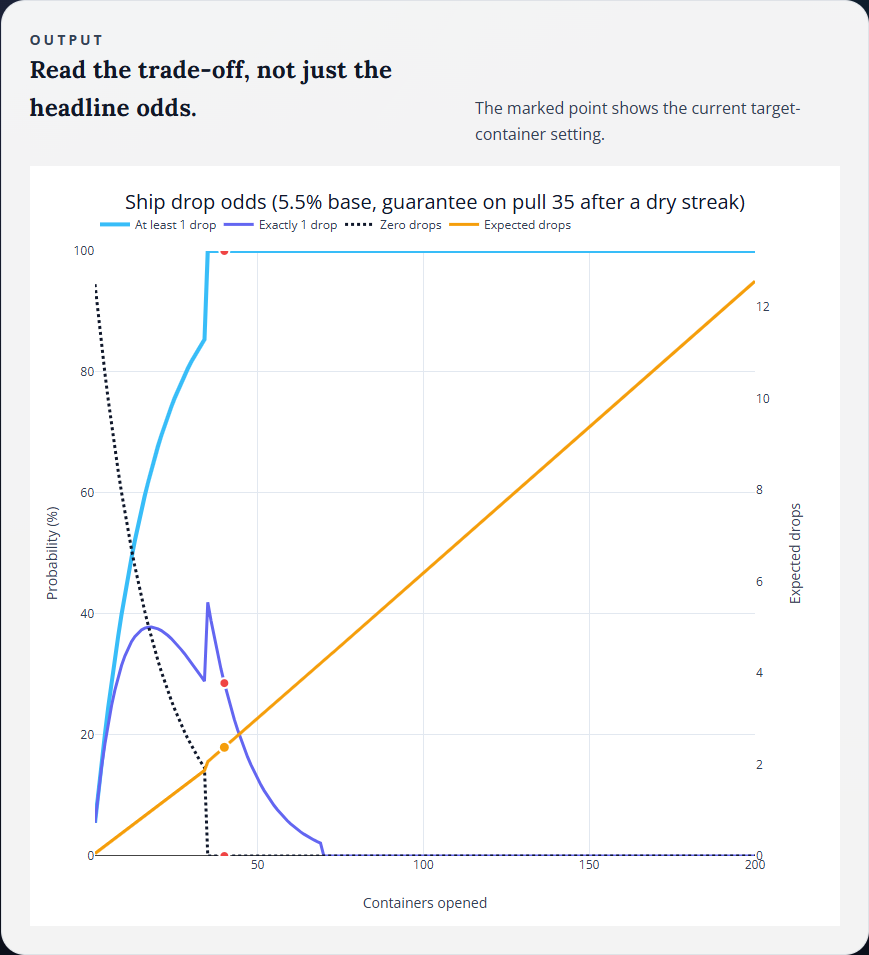
The simulator models a base drop rate, a configurable number of pulls, and an optional pity rule, then turns those assumptions into cumulative probability curves and summary statistics.
- Show the chance of at least one drop, exactly one drop, and zero drops.
- Show expected drops over a configurable range of container counts.
- Make pity logic explicit so it can be reasoned about instead of assumed.
3. Evidence
4. Outcome
The tool reframes a monetization mechanic as a probability problem. That is useful both for players thinking clearly about expected outcomes and for anyone designing consumer-facing systems that rely on repeated draws.
5. Tech stack
- Client-side JavaScript probability model
- Plotly for interactive charts
- Responsive UI with scenario controls for drop rate, pull count, and pity threshold
6. Useful links
7. Related reading
8. Call to action
Open the interactive simulator if you want to inspect the curves yourself, or get in touch if you need a similar decision-support tool for another probability-heavy system.