1. Problem
Reward analytics needed to combine live contract state, market pricing, and capacity context. None of those lived in one place, and nobody wanted a reporting stack that depended on hand-maintained exports.
2. Approach
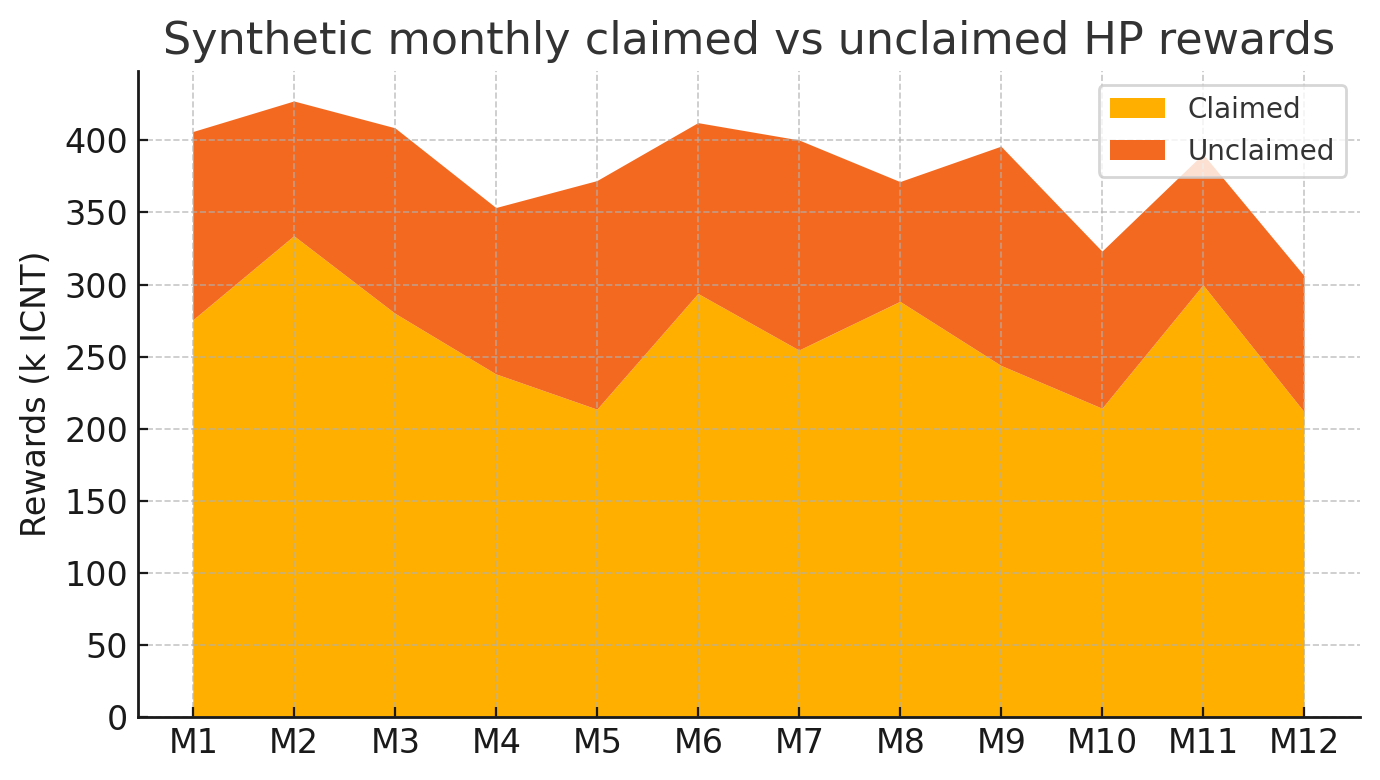
The pipeline pulled contract data, blended it with market feeds and capacity data, then published a presentation layer designed for dashboards rather than notebooks.
- Read on-chain state directly from the contracts.
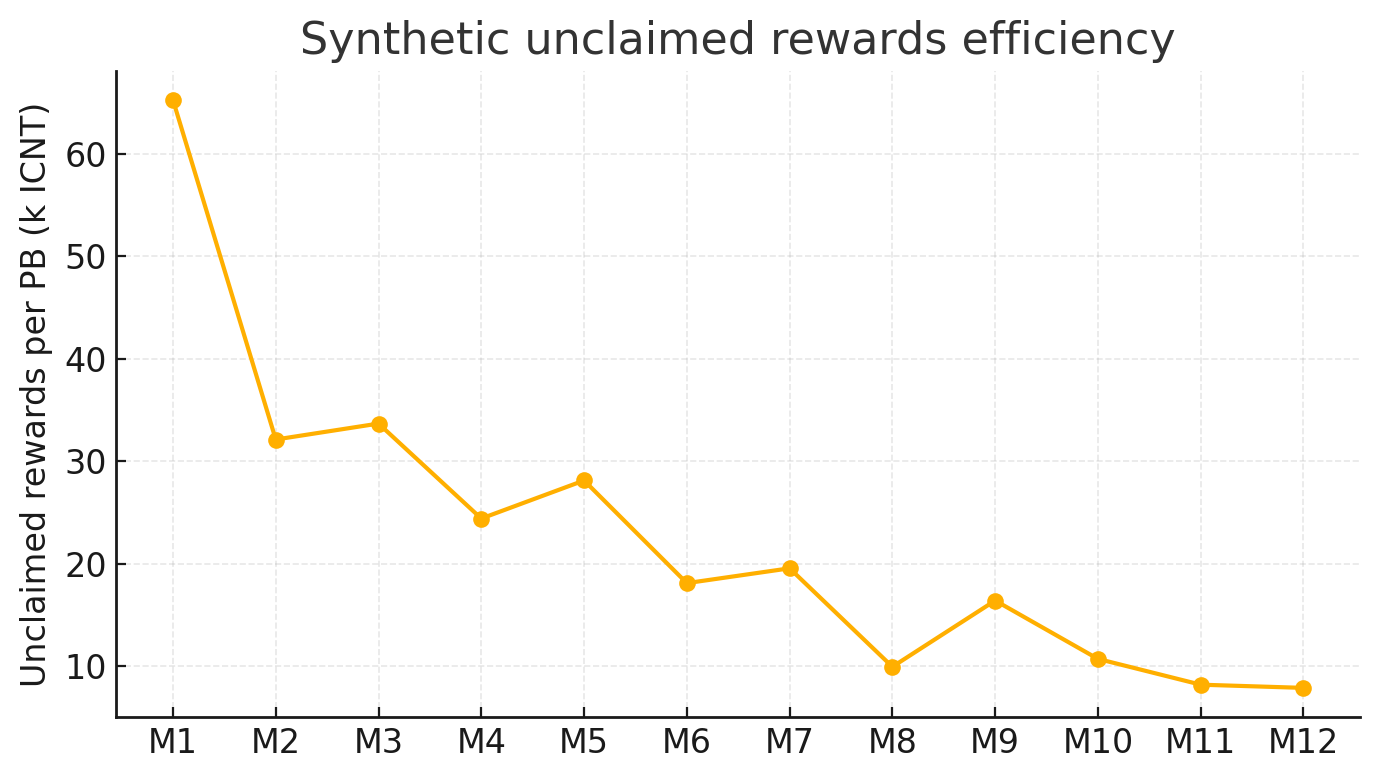
- Join token counts to market prices and capacity metrics upstream.
- Expose stable presentation-layer tables to BI consumers.
3. Evidence
4. Outcome
The resulting analytics surface supported investor, finance, and operations conversations without forcing each audience to reconstruct the data story from separate dashboards.
5. Tech stack
- web3.py and exchange-feed ingestion
- Databricks and Delta-backed transformations
- Tableau presentation-layer reporting
6. Useful links
7. Related reading
8. Call to action
If you need one reporting layer across on-chain, market, and operational data, I can help design the ingestion and presentation model that makes it hold together.