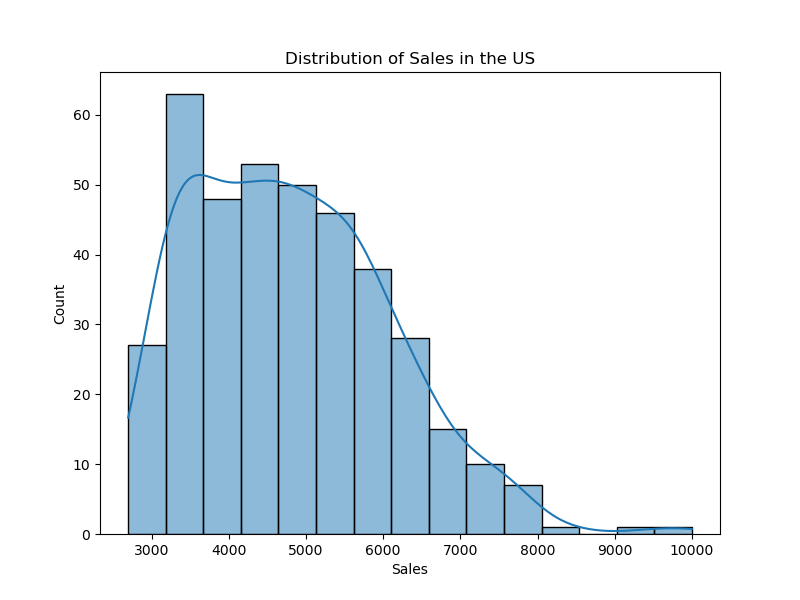
1. Problem
Teams often treat chart ranking as a proxy for sales performance. The harder question is how ranking, impressions, and sales interact over time, and whether chart position is a driver, a consequence, or both.
2. Approach
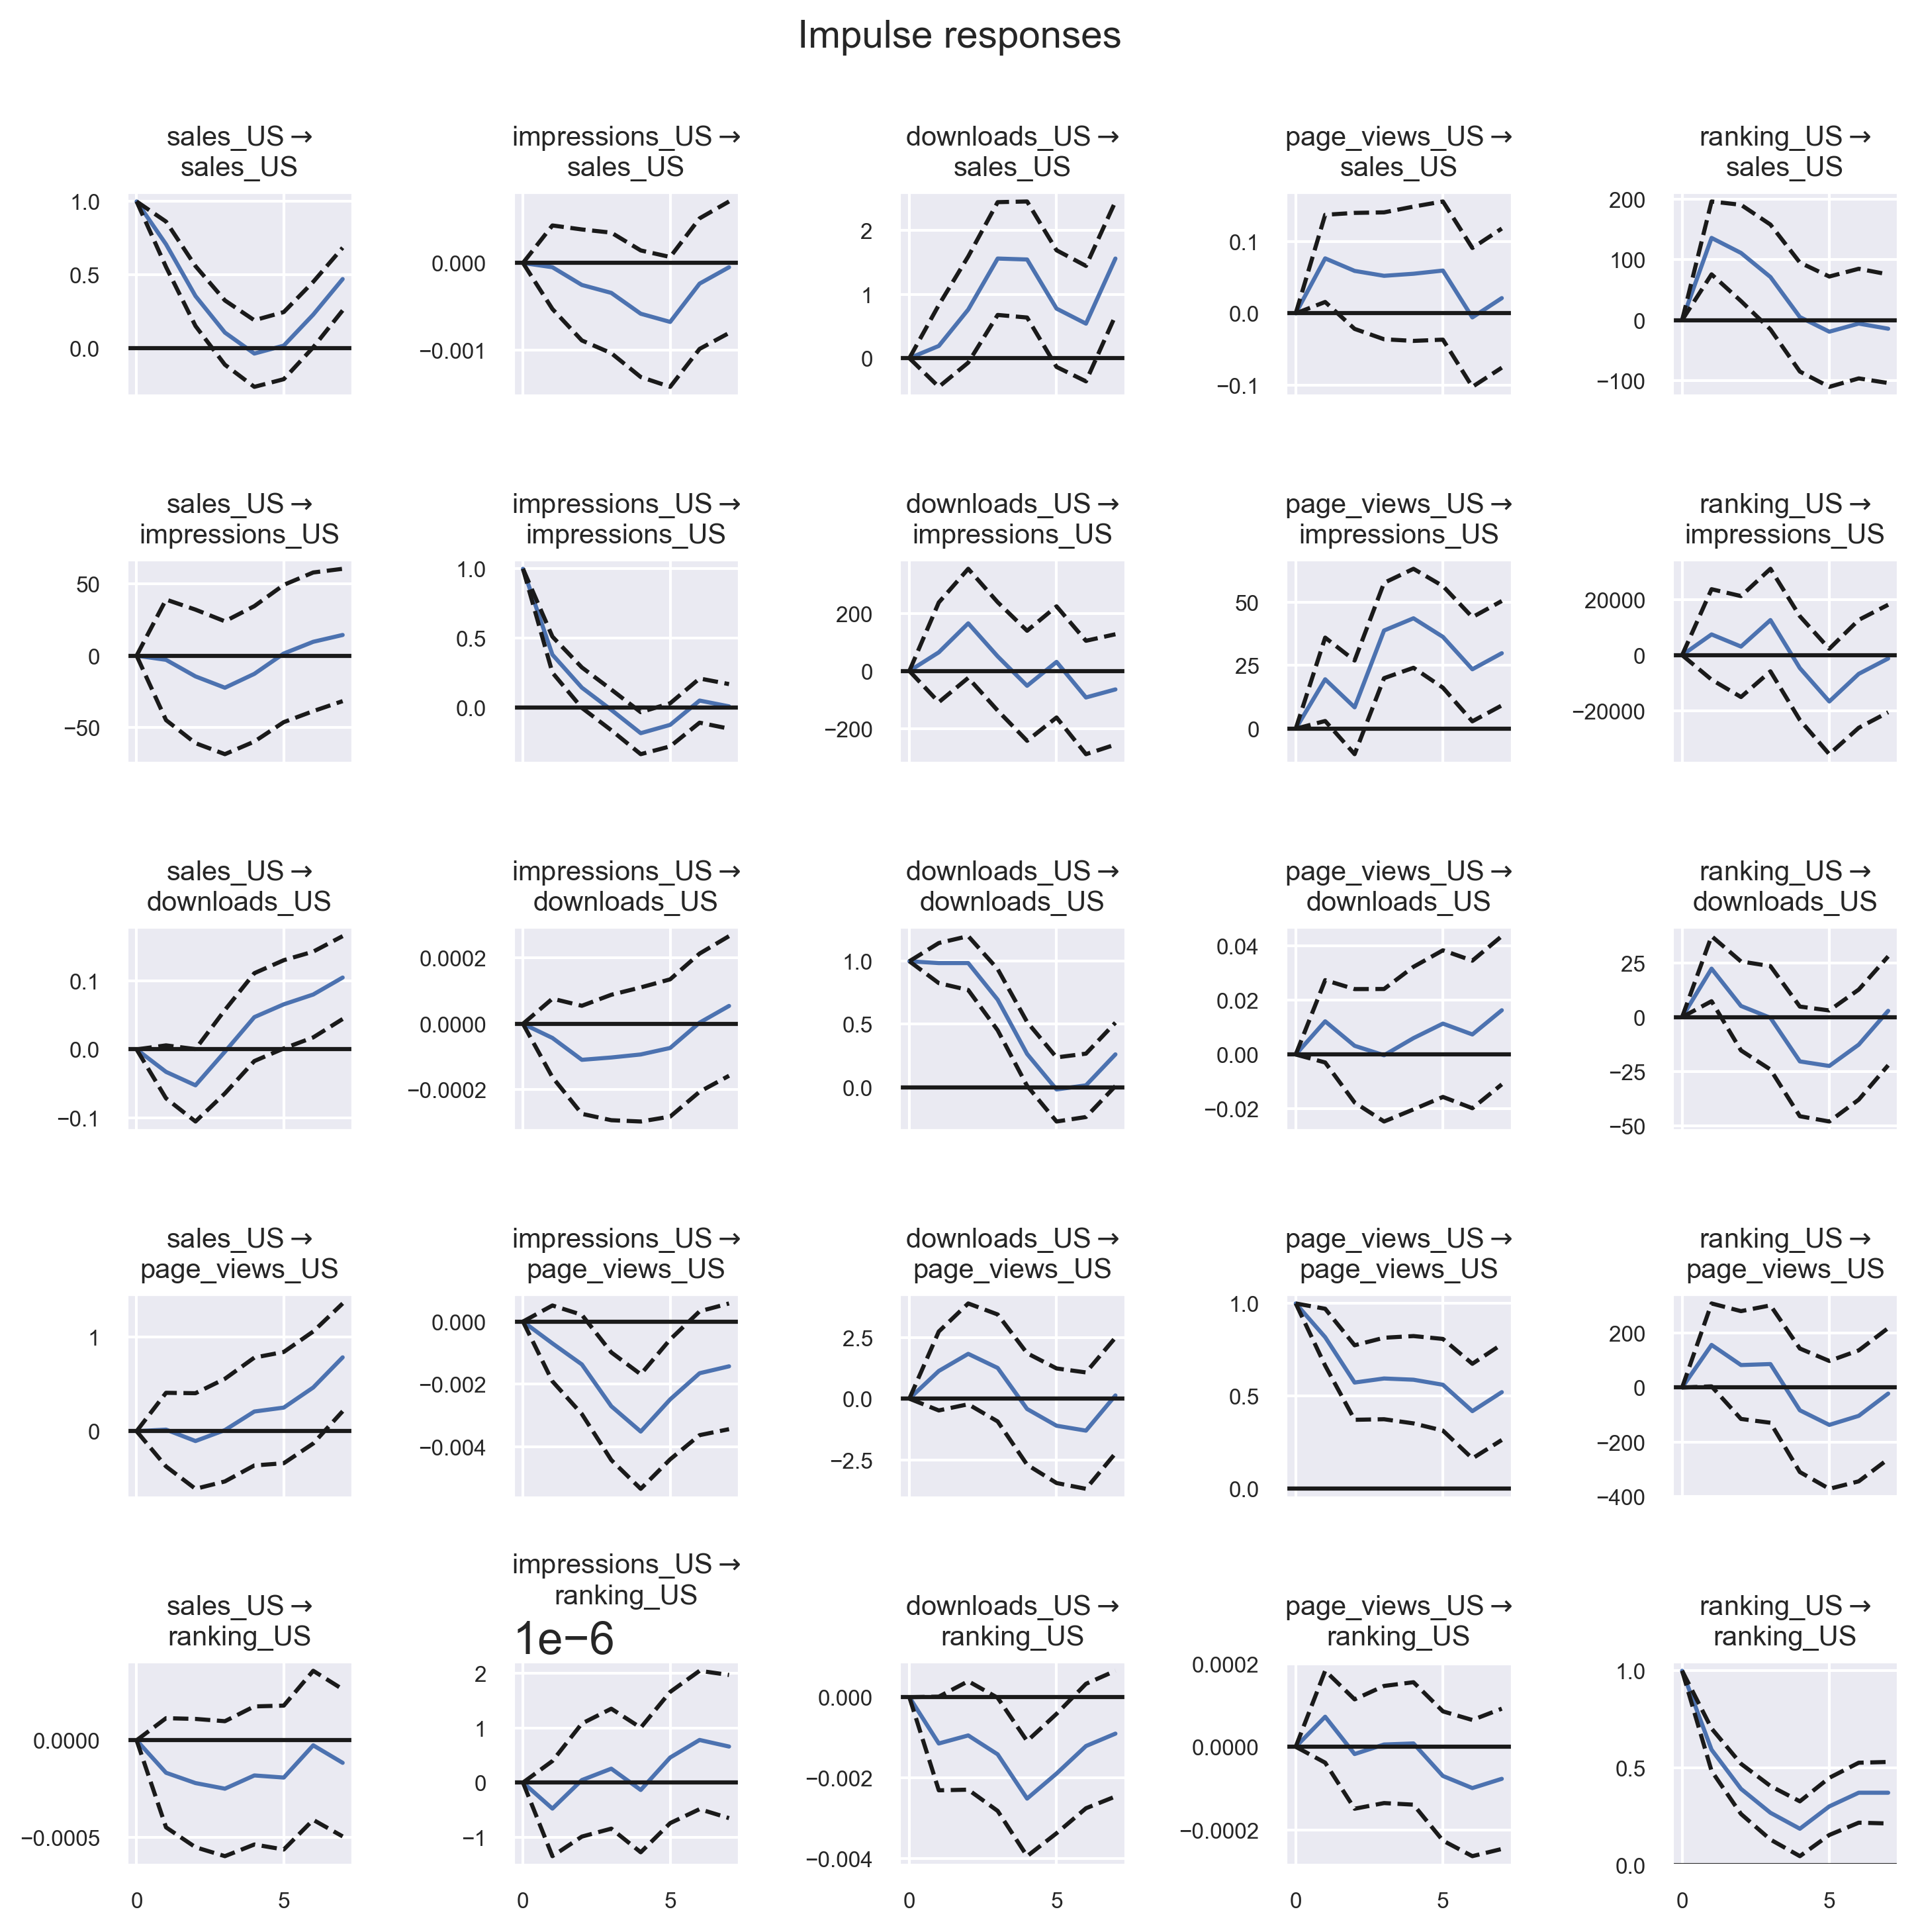
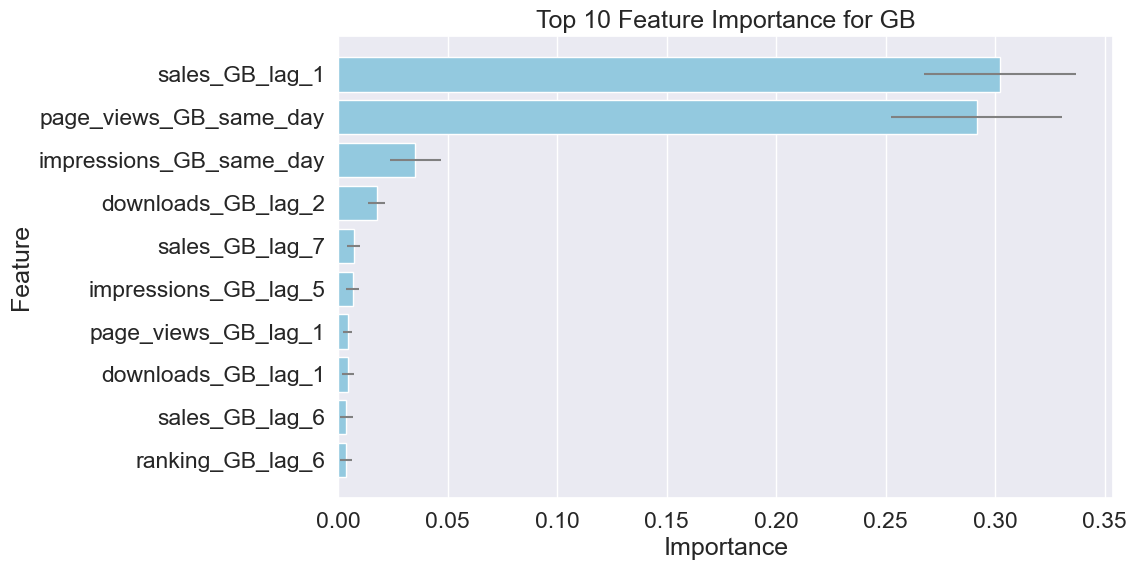
I combined time-series analysis with feature-importance views to examine the relationship from more than one angle. That avoided the trap of declaring one clean causal story from a messy market system.
- Look at the temporal relationship, not just static correlations.
- Compare signal quality across markets and metrics.
- Use feature importance to see what actually predicts sales movement.
3. Evidence
4. Outcome
The study challenged the simplistic narrative that better ranking automatically means better sales and gave a more nuanced view of visibility, momentum, and market response.
5. Tech stack
- Statsmodels for time-series analysis
- Gradient-boosting models for comparative feature views
- Pandas and visualization tooling for exploratory analysis
6. Useful links
7. Related reading
8. Call to action
If your growth analysis still depends on one proxy metric standing in for the whole market system, I can help build the analysis that disentangles it.